Insurance Risk Assessment Explained with AI Examples
Learn insurance risk assessment fundamentals, AI-augmented scoring, models and metrics, plus real case outcomes and governance tips.
Written by AI for Insurance
You're reviewing two homes that look similar on paper. Both have comparable floor areas, similar construction, and the same requested coverage. Yet one receives a higher premium, a tighter deductible, or a request for more information. That difference isn't arbitrary. It reflects how the insurer estimates the chance of loss, the likely cost of that loss, and whether the proposed price provides enough capacity for the exposure.
That is the practical purpose of insurance risk assessment. It turns uncertainty into a decision about whether to insure, how much to charge, what terms to apply, and how much risk the portfolio can absorb. The process has moved from broad historical averages toward more granular models, external data, and machine-learning support, but the central responsibility hasn't changed.
Core idea: Risk scoring measures, models, and prices uncertainty. It doesn't remove uncertainty.
Underwriters, actuaries, pricing analysts, and insurance innovation leaders all face the same question from different angles: which signals improve a decision, and which ones create false confidence? The answer requires more than an accurate prediction. It requires sound data, understandable reasoning, regulatory discipline, and a clear view of where insurance capacity is available.
Table of Contents
- Introduction to Insurance Risk Assessment Today
- How Insurance Risk Assessment Evolved From Tables to Models
- Core Metrics and Signals That Shape Risk Scores
- How AI and Machine Learning Augment Actuarial Scoring
- Real World Examples and Measured Outcomes
- Validation Governance and the Limits of Better Models
- Putting Risk Assessment Into Practice With Confidence
Introduction to Insurance Risk Assessment Today
A risk score is useful only when it changes a business decision. For an underwriter, that may mean accepting a property, declining it, adjusting the premium, or requesting an inspection. For an actuary, it may mean separating claim frequency from claim severity and testing whether the portfolio remains adequately priced. For an innovation lead, it may mean deciding whether a machine-learning system is ready for controlled deployment.
The same applicant can receive a different result from another applicant who appears similar because small details change expected loss. A roof's condition may interact with local weather exposure. Driving behavior may change the meaning of a vehicle's claims history. A business location may carry a different accumulation risk from another location with the same industry classification.
Good assessment therefore looks beyond labels such as “low risk” or “high risk.” It asks what could happen, how often it could happen, how severe the outcome could be, and whether the insurer can responsibly offer coverage at the proposed terms.
What a modern score needs to answer
A practical assessment should connect four decisions:
- Eligibility: Does the risk meet the insurer's rules and appetite?
- Price: What premium reflects the expected loss and required margin?
- Terms: What deductible, limit, exclusion, or condition is appropriate?
- Capacity: Can the insurer retain this exposure within its portfolio and reinsurance structure?
These decisions explain why better prediction doesn't automatically create better insurance. A model can rank properties effectively while the market still struggles with affordability, incomplete catastrophe data, or insufficient capacity. Precision helps, but it operates inside a wider underwriting system.
The learning path is progressive. First comes the statistical foundation, then the metrics and signals that shape a score. From there, machine learning can be evaluated as an augmentation layer rather than a replacement for actuarial judgment. Finally, validation, bias, explainability, liability, and natural-catastrophe protection gaps determine whether a technically strong model is commercially and socially usable.
How Insurance Risk Assessment Evolved From Tables to Models
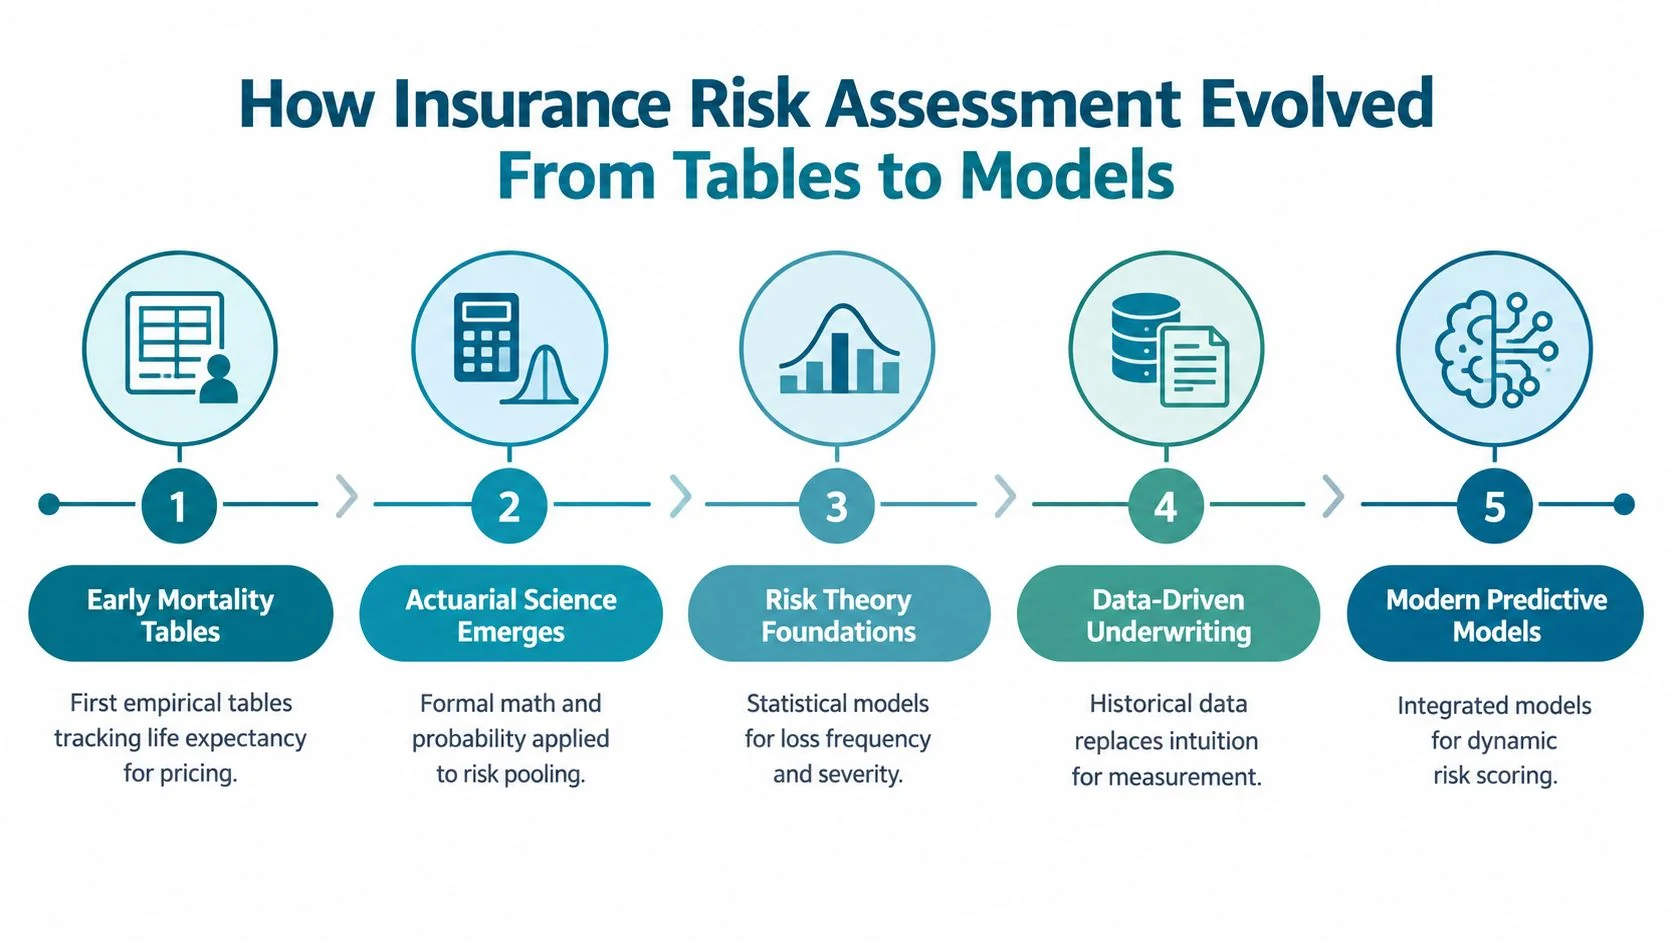
In the early days of life insurance, an underwriter had to decide whether a group's observed mortality could support a sustainable price. Edmund Halley's 1693 survival table became an early major attempt to quantify human mortality for insurance pricing. Age-based life insurance premiums followed roughly 70 years later, shifting underwriting from intuition toward recorded experience, as described in this historical overview of actuarial risk assessment.
The table mattered because it created a repeatable method. Insurers could record exposure, sort people into groups, compare outcomes, and estimate future obligations. Each new observation added another mark to the map. Pricing became less dependent on one underwriter's personal judgment.
From observations to actuarial structure
Actuarial science then gave this process a mathematical structure. The Institute of Actuaries was founded in 1848, and later work developed insurance risk theory through Lundberg's 1909 non-life insurance model and Cramér's 1930 contribution to that field, as recorded in the historical overview cited above.
The underlying workflow remains familiar:
- Collect experience. Record exposure, claims, timing, and outcomes.
- Organize the experience. Group risks by characteristics that may explain different results.
- Estimate expected outcomes. Separate the chance of a claim from its potential size.
- Add uncertainty margins. Allow for actual results to differ from the average.
- Use the estimate operationally. Apply it to pricing, reserving, portfolio selection, and capital decisions.
A surveyor's map offers a useful comparison. An early map might show coastlines and major roads. Later surveys can add elevation, terrain, weather patterns, and hazards. Modern risk models refine the map in much the same way, using more variables and faster calculations. The refinement helps an insurer decide not only whether to write a policy, but also what price, terms, and retained capacity the exposure can support.
More detail does not guarantee a better decision. A map based on inaccurate measurements can misdirect travelers more effectively than a simple, clearly limited map. Risk models face the same problem when data is incomplete, biased, or poorly matched to the peril being assessed.
Risk monitoring at market scale
Assessment now operates at both policy and market levels. Regulators and market participants track broad indicators across companies and sectors. The European Insurance and Occupational Pensions Authority's Insurance Risk Dashboard reports quarterly and annual indicators for the European insurance sector, with company data referenced to Q1 2026 for quarterly measures and 2025 year-end for annual measures.
That wider view changes the capacity question. An insurer may price individual policies sensibly while accumulating excessive exposure in one region, peril, or line of business. Risk assessment therefore asks two connected questions: should this policy be written, and what does it add to the portfolio's ability to absorb losses?
Core Metrics and Signals That Shape Risk Scores
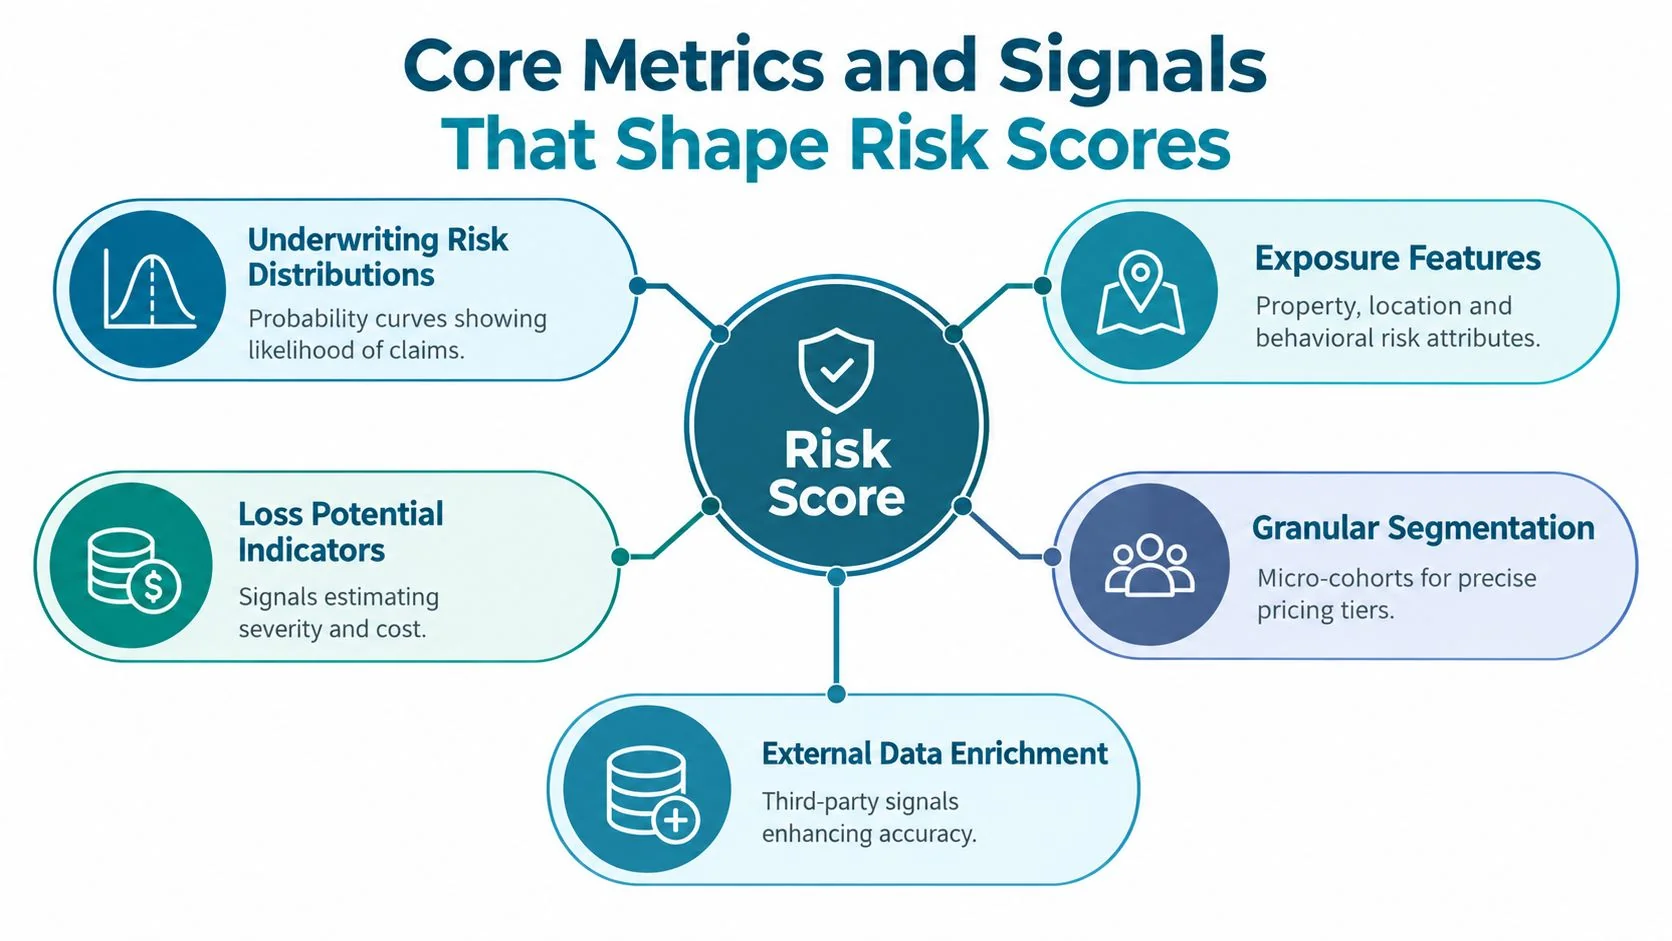
A risk score is a structured estimate, not a mysterious number from a black box. It brings together signals about claim likelihood, claim severity, and portfolio impact. The underwriting decision follows from that estimate: what price fits the exposure, which terms are appropriate, and how much capacity the insurer can retain.
A Nigerian non-life insurance study reported an average underwriting risk of 0.411%, with a standard deviation of 0.284, a maximum of 1.957, and a minimum of 0.055. The sample covered Nigerian non-life insurers during the study's stated market period, so these figures describe that market and period rather than a global benchmark. Their value lies in showing a distribution of observed outcomes. A single average cannot set a premium, but the spread can show whether a portfolio contains risks that differ materially from its broad label.
The signals behind the score
Exposure features describe what is insured, where it is located, and how it is used. For property, construction, occupancy, location, and condition may shape the assessment. Motor underwriting may consider vehicle attributes and driving behavior. Life underwriting may use applicant characteristics and disclosed medical evidence, subject to applicable rules.
Loss potential indicators address severity. Two policyholders can have a similar chance of claiming while creating very different obligations for the insurer. Limits, replacement costs, concentration, business interruption exposure, and the nature of the insured assets affect the amount that could be paid.
Granular segmentation replaces broad class averages with smaller groups that share meaningful characteristics. The purpose is not to divide customers without limit. A useful segment must remain stable, explainable, legally acceptable, and relevant to price or terms.
External data enrichment adds evidence that a policy file may not contain. Satellite imagery, sensor readings, economic indicators, and other permitted sources can reveal changing conditions around an insured asset. That evidence must support consent, privacy, and fairness requirements rather than bypass them.
Each signal should answer a defined underwriting question. If a feature cannot be connected to exposure, frequency, severity, or accumulation, its effect on the score deserves review.
Matching signals to insurance lines
| Line of business | Signals that often deserve attention | Decision question |
|---|---|---|
| Property | Building condition, location, peril exposure, insured value | Could the asset suffer a severe or concentrated loss? |
| Motor | Vehicle characteristics, driving history, telematics where permitted | Does observed behavior add information beyond past claims? |
| Life | Age-related and disclosed risk factors, policy terms | How might obligations develop over the policy period? |
| Commercial | Operations, revenue dependency, location, limits, controls | What combination of operational and financial exposures drives severity? |
For a practical foundation, readers can review this guide to what insurance risk means. The interpretation matters more than the label. A signal does not set a premium by itself. It changes the insurer's estimate, which informs pricing, terms, and the capacity assigned to the exposure.
How AI and Machine Learning Augment Actuarial Scoring
A property application can look ordinary until two modest signals appear together: an older roof and high hail exposure. Traditional actuarial models remain valuable because their variables, rating factors, and logic are documented and familiar to governance teams. Their limitation appears when broad averages conceal interactions that materially change one risk's expected loss.
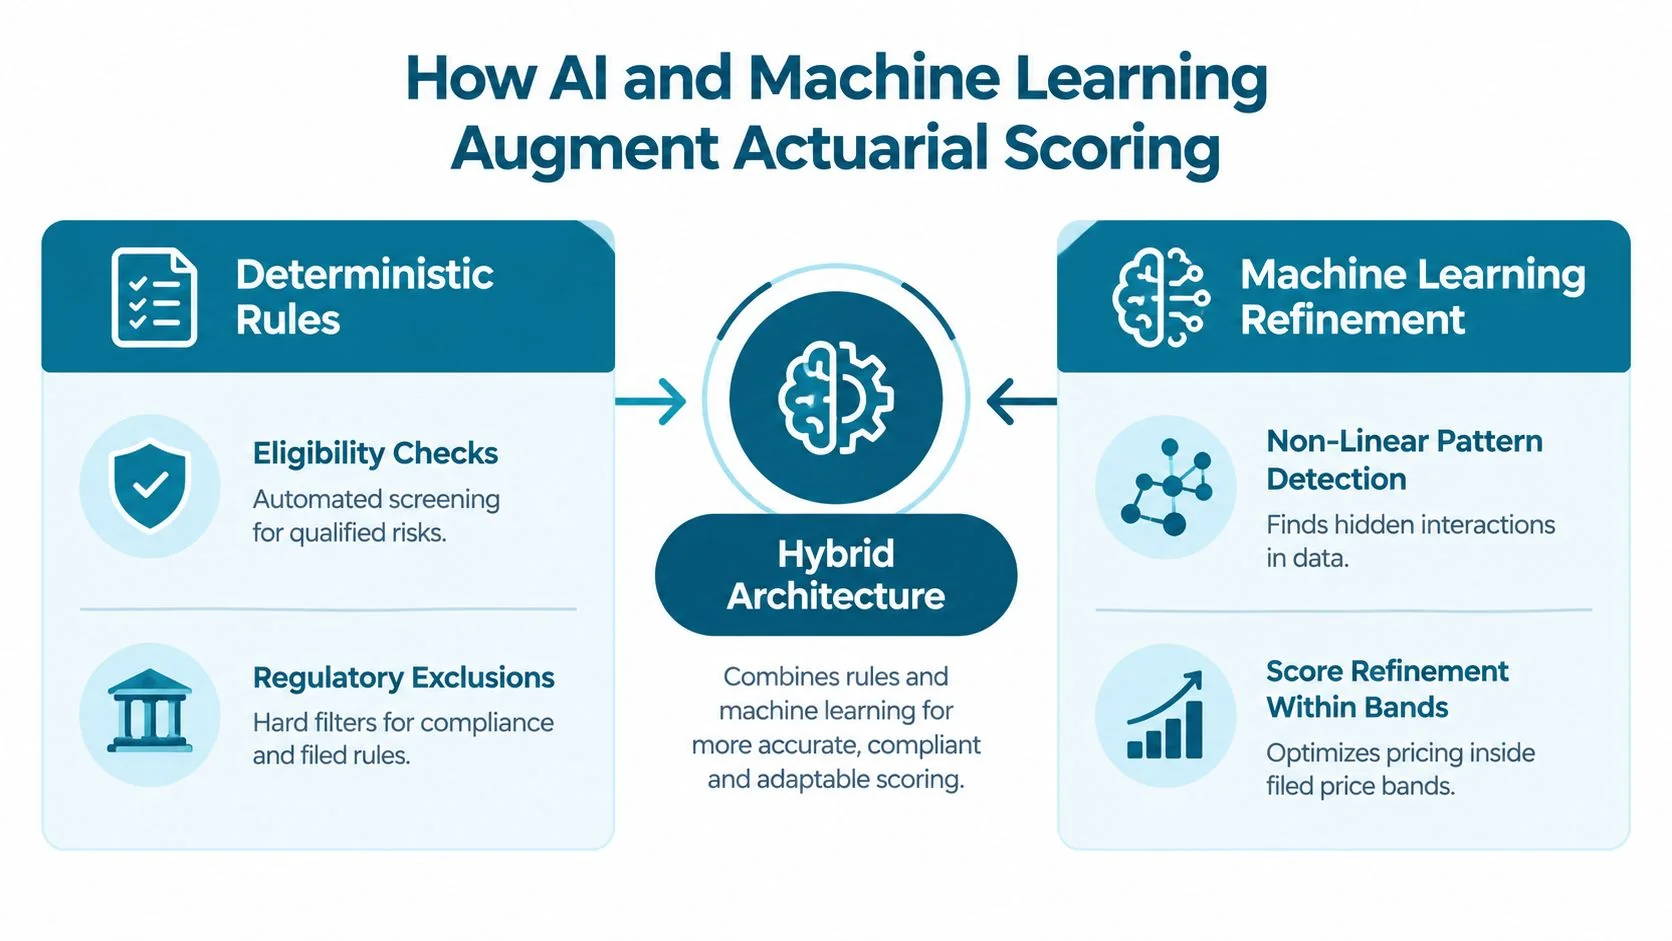
A hybrid architecture handles that gap without handing the entire underwriting decision to a model. Deterministic rules manage eligibility, regulatory exclusions, and filed requirements. Machine learning then refines the score within approved price bands, identifying patterns that fixed rules express poorly. The approach is discussed in guidance on data and analytics in property and casualty underwriting.
Rules and learning perform different jobs
The rules layer works like a gate. It checks whether an application may enter the process under policy and regulation. The model layer works like a camera behind that gate, examining permitted risks in finer detail.
In property insurance, roof condition, construction details, and peril exposure may interact rather than contribute separate, fixed effects. In motor insurance, permitted telematics can show how driving behavior occurs, adding context to historical outcomes. These non-linear interactions can sharpen segmentation, while rules retain control over eligibility and pricing boundaries.
Machine learning can also combine conventional policy information with satellite imagery, IoT sensors, social media, and economic indicators where their use is permitted. The predictive analytics in insurance overview describes how these methods can support underwriting decisions. Their value depends on a clear underwriting question, reliable data, appropriate consent, and testing that reflects the portfolio.
The business decision is broader than a score. Better segmentation may place similar expected losses into more consistent price bands, while weak data or limited reinsurance capacity can restrict the amount of risk an insurer is willing to write. AI improves the estimate. Governance and catastrophe protection determine how much that estimate can change pricing or capacity.
Practical rule: Use AI to improve the estimate inside a governed decision boundary. Do not use it to avoid the boundary.
Every output should have a traceable explanation. Underwriters need to know why a score moved, actuaries need to test its stability, and compliance teams need to assess whether inputs and outcomes are defensible. A controlled operating model matters more than a standalone data-science experiment.
This video provides a visual introduction to how machine learning can support insurance workflows:
<iframe width="100%" style="aspect-ratio: 16 / 9;" src="https://www.youtube.com/embed/tah6-upp2qw" frameborder="0" allow="autoplay; encrypted-media" allowfullscreen></iframe>
Real World Examples and Measured Outcomes
A property insurer may have two buildings in the same rating class, yet their expected losses can differ because of construction, occupancy, maintenance, or exposure. A useful model separates those risks more precisely. The business result is a pricing and capacity decision: the carrier can set more consistent prices within approved ranges and decide which risks it has room to write.
One study covering more than 100,000 policies reported a 35% improvement in risk prediction accuracy and a 15–20% reduction in loss ratios. These results were compared with a GLM baseline using the same 100,000-policy P&C portfolio and a 12-month claim window, measured in live production from Q2-Q4 2024, as reported in the study of machine-learning risk prediction and loss ratios. The figures describe that study's design and operating conditions, not a guaranteed result for every insurer.
A second reference helps establish a different comparison point. The Nationwide Insurance model-factory case study describes a large-scale modeling initiative. It is useful for examining how an implementation is organized and evaluated, rather than treating scale or model volume as proof of underwriting value.
How to read an outcome responsibly
A score is valuable only when it changes a decision that matters. Underwriting teams should connect model performance with practical effects:
- Sharper segmentation: Does the model separate materially different loss profiles within an existing class?
- Pricing discipline: Does the estimate support more consistent movement inside approved rating ranges?
- Capacity use: Does the carrier write more of the risks it understands, while referring or limiting risks outside its appetite?
- Portfolio effect: Does the change improve the mix of risks, or merely reorder the same risks?
- Loss-ratio movement: Is the result measured against a defined baseline, with the same portfolio and claim window?
- Deployment conditions: Did the outcome come from testing, a pilot, or live production?
Loss-ratio movement needs context. Claims handling, policy terms, portfolio composition, and exposure mix can affect results alongside the model. Analysts should test whether the model added value after those factors were considered.
Benchmarking works best when the question is narrow. A team might examine whether external property information improves pre-bind selection, or whether document extraction reduces manual review without increasing referral errors. A defined baseline, monitored exceptions, and a stated capacity decision make the result easier to judge.
Measured outcomes connect technical performance to underwriting economics. If a team cannot explain what improved, against which baseline, and under what conditions, it does not yet have a dependable business case. Even a better segment score cannot expand catastrophe protection or reinsurance capacity by itself. Those constraints still determine how far pricing and acceptance decisions can change.
Validation Governance and the Limits of Better Models
A better prediction can still produce a poor insurance decision. The model may learn from incomplete evidence, reproduce historical bias, misread unstructured documents, or create liability that the business hasn't assigned to anyone. The more influential the model becomes, the more important it is to monitor not only accuracy but also behavior.
The governance challenge becomes sharper when evidence is limited. The IAIS Global Insurance Market Report 2025 identifies AI-related liability underwriting as an area with limited evidence and continuing supervisory attention. That raises a difficult question: how should an insurer price or accept emerging risks when historical data are sparse and the model's confidence may be overstated?
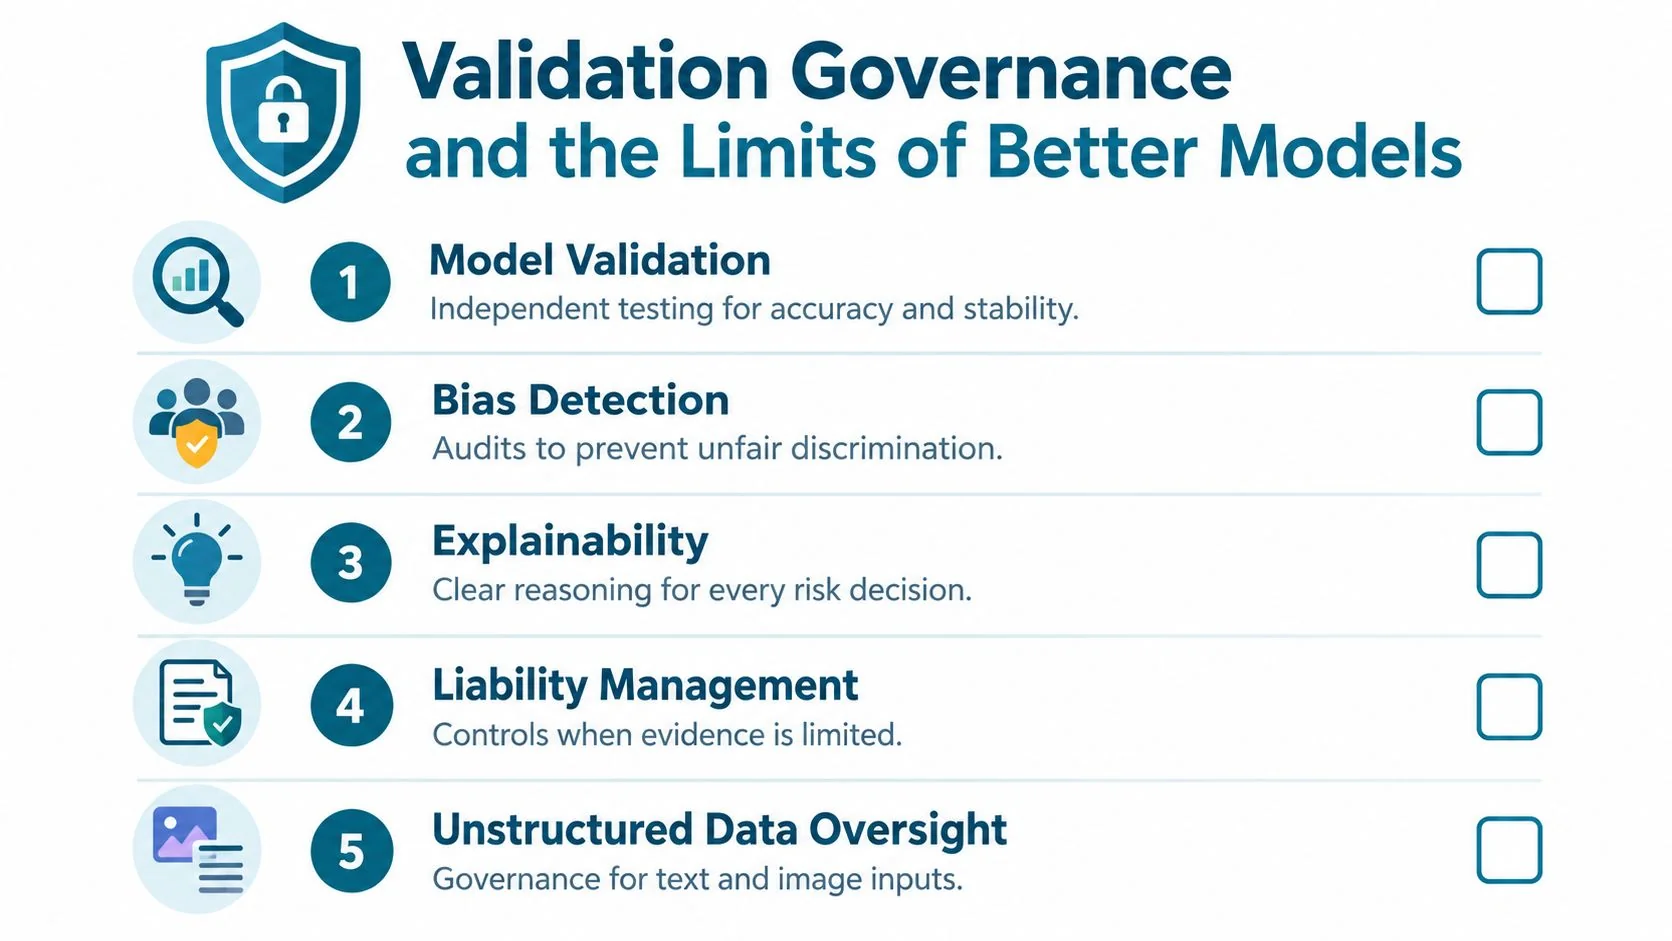
A practical oversight checklist
Model validation should test whether the model performs consistently across relevant segments and remains stable when the underlying portfolio changes. Independent review is particularly important when the model influences eligibility, price, limits, or referral decisions.
Bias detection examines whether inputs, proxies, or outcomes create unfair differences between groups. A model can appear statistically effective while still relying on variables that are difficult to defend ethically or legally.
Explainability means more than producing a technical feature-importance chart. The underwriter and customer-facing teams need a usable explanation of the factors that changed the decision and the limits of that explanation.
Liability management assigns responsibility for model outputs, overrides, data errors, and adverse outcomes. This matters when AI-related liability is itself being assessed with limited historical evidence.
Unstructured-data oversight covers documents, images, notes, and other inputs that may contain inconsistent wording, missing context, or sensitive information. Extraction quality should be monitored before those inputs affect a risk score.
The protection-gap problem
Natural-catastrophe assessment exposes a limit that model accuracy alone can't solve. The IAIS has emphasized the need for thorough catastrophe data, trend analysis, and reform plans that address uninsured and underinsured exposure. The global natural-catastrophe protection gap reached $262 billion in 2023, up from $181 billion in 2022, according to the IAIS protection-gap material.
That gap changes the insurer's question. Better scoring may identify exposure more precisely, but it may also reveal that coverage is unaffordable, unavailable, or limited by insufficient market capacity. In those cases, the constraint isn't merely model performance. It may be data availability, policy design, public infrastructure, reinsurance access, or the customer's ability to pay.
A precise model can identify an exposure. It can't, by itself, create affordable capacity for that exposure.
Governance should therefore track both model risk and market consequences. A responsible review asks whether better segmentation improves pricing discipline while also identifying populations or regions that are becoming difficult to insure.
Putting Risk Assessment Into Practice With Confidence
A practical insurance risk assessment program starts with the decision, not the algorithm. Define whether the immediate objective is better eligibility screening, more precise pricing, improved portfolio selection, or earlier identification of capacity constraints. Each objective requires different data, validation tests, and success measures.
Use this decision sequence:
- Define the exposure. Specify the insured asset, peril, policy term, limits, and relevant accumulation concerns.
- Select defensible signals. Prefer variables with a clear connection to frequency, severity, exposure, or portfolio concentration.
- Set the control boundary. Keep eligibility and regulatory requirements in deterministic rules, then use machine learning where refinement adds value.
- Measure the outcome. Establish a baseline and test prediction quality, loss-ratio movement, referral patterns, and operational effects.
- Govern the result. Document ownership, validation, explainability, bias testing, overrides, and monitoring triggers.
Underwriters should focus on whether the score improves a real decision. Actuaries should test whether the signal remains credible across segments and time. Innovation leaders should insist on a controlled pilot with clear stop conditions rather than treating deployment as proof of value.
A searchable evidence base can support benchmarking when it uses consistent taxonomies, line-of-business filters, use-case categories, and disclosed implementation details. That makes it easier to compare like with like instead of relying on impressive but incomplete claims.
The most valuable outcome may be a better price. It may also be a clearer answer that a market lacks data or capacity. Both are legitimate findings. Use risk assessment to identify where sharper segmentation can support sustainable underwriting, and where the industry needs a broader response.
If you're evaluating an AI underwriting initiative, explore the AI for Insurance searchable database to compare documented implementations by insurance line, use case, technology, and measured outcome. Start with one decision, define its baseline, and build your pilot around evidence that an underwriting team can act on.
