What Is Insurance Risk and How Insurers Measure It
What is insurance risk? Learn how insurers define, measure, and price risk using frequency, severity, and emerging data to underwrite policies and set reserves.
Written by AI for Insurance
Insurance risk is the measurable variation in the timing, frequency, and severity of future losses relative to what an insurer expects. Insurers quantify it so they can price premiums, set reserves, and hold capital against adverse outcomes.
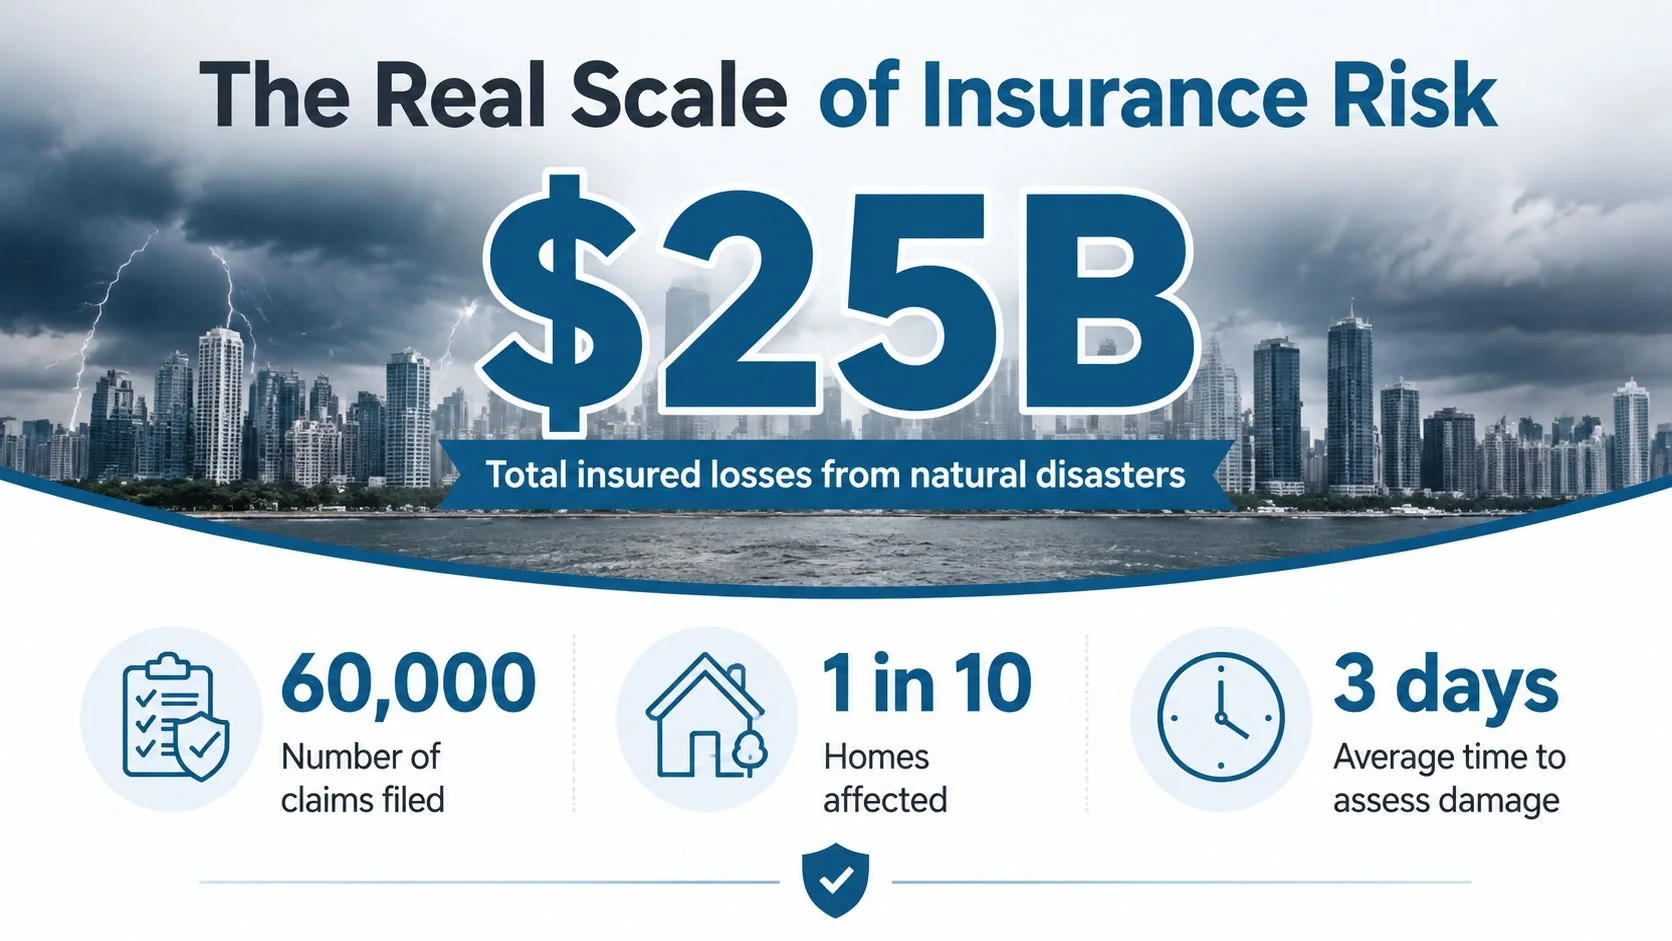
That matters because the scale isn't theoretical. The U.S. recorded 403 weather and climate disasters since 1980 with total costs above $2.915 trillion, and 2024 alone brought 27 billion-dollar disasters and $99 billion in insured losses, the second-highest on record (NAIC natural catastrophe risk dashboard report). Insurance risk is the business problem of turning that kind of volatility into a price, a reserve, and a capital plan.
Table of Contents
- The Real Scale of Insurance Risk
- The Four Dimensions of Insurance Risk
- How Actuaries Model Risk Variation
- From Risk Measurement to Underwriting Decisions
- When Risk Becomes Uninsurable or Underserved
- Emerging Risks Reshaping the Landscape
- A Practical Framework for Evaluating Insurance Risk
The Real Scale of Insurance Risk
The first thing to understand about insurance risk is that it's not just “something bad might happen.” It's the gap between what an insurer expects and what arrives in claims. The size of that gap matters because claims volatility can overwhelm naive pricing, even when the underlying hazard is familiar.
The catastrophe record makes that visible. Over 1980 to 2024, the U.S. averaged 9.0 billion-dollar disasters a year, but the most recent five-year average rose to 23.0 (NAIC natural catastrophe risk dashboard report). That shift tells you something important. Insurers aren't dealing with random background noise, they're dealing with a heavier tail of severe loss experience that has to be absorbed somewhere in the system.
A better definition than “chance of loss”
A simple definition often stops at probability. That's too thin for underwriting, pricing, and capital work. In actuarial practice, insurance risk is about the variation in timing, frequency, and severity of insured events relative to underwriting expectations, including settlement timing, claim size, expense overruns, and accumulation from a single cause (FCA handbook).
That definition is more useful because it tells you where the uncertainty lives. A portfolio can have a known hazard and still be risky if claims arrive earlier than expected, cluster in one region, or settle above assumptions. A good underwriter doesn't ask only, “Can this loss happen?” They ask, “How far can actual experience drift from the assumption set?”
Practical rule: If a product can produce losses that are clustered, delayed, inflated, or unexpectedly correlated, the risk is bigger than its headline loss probability suggests.
That's why insurance risk is best treated as a distribution, not a point estimate. The insurer's job is to understand the range of possible outcomes and decide how much of that range the premium, reserve, and capital base can support.
The Four Dimensions of Insurance Risk
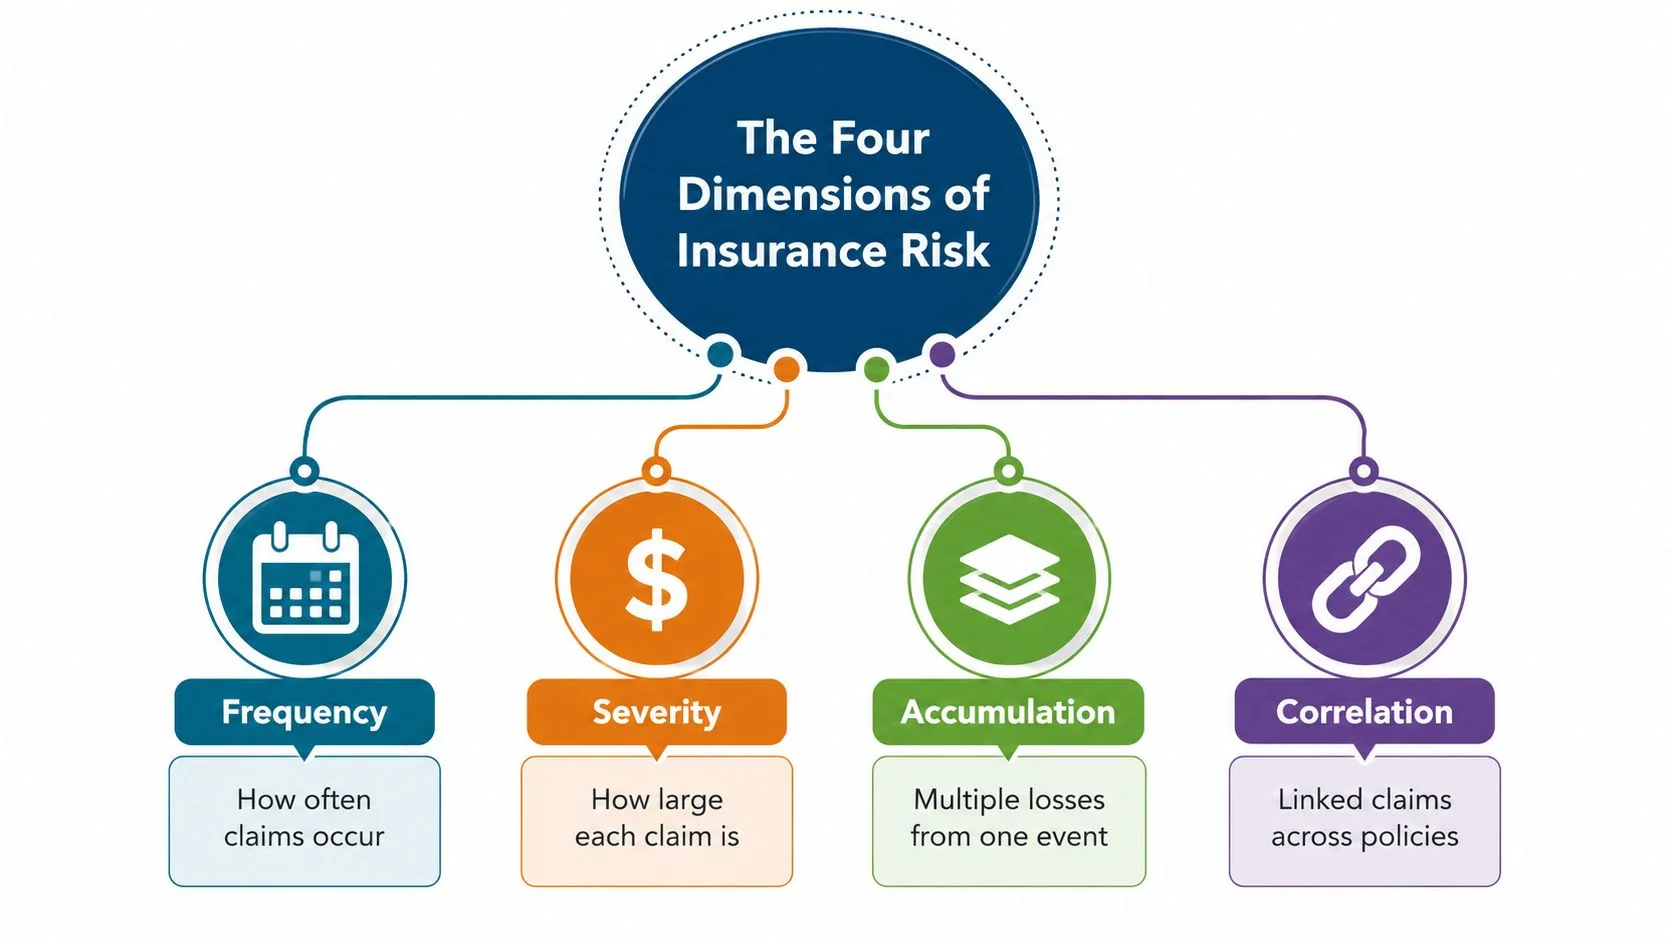
Once you move beyond the textbook definition, the picture gets more operational. Underwriters and actuaries usually decompose risk into four linked dimensions, and each one pushes decision-making in a different direction. A portfolio can look safe on one dimension and dangerous on another, which is why a single “risk score” often misses the point.
Frequency and severity are not the same thing
Frequency risk is how often claims happen. Severity risk is how large each claim becomes. In U.S. homeowners data from 2014 to 2018, 5.6% of insured homes had a claim, about 1 in 20 homes each year, and 2.3% had wind or hail losses, which were the most frequent property claims (Insurance Information Institute factbook). That tells you frequency is real, measurable, and line-specific.
But frequency alone doesn't tell the whole story. Wind and hail may be frequent, while a hurricane can produce fewer claims with much larger losses per claim. That's why a portfolio with modest claim counts can still create serious capital strain. If you only watch claim counts, you'll miss the severity tail.
Accumulation and leakage change the economics
Accumulation risk appears when many claims come from the same event. A storm can trigger hundreds of losses across one geography, so the insurer faces a shared shock rather than isolated events. This is the part of risk that makes catastrophe modeling and reinsurance so central in property lines.
Leakage risk is the quiet drain. The same homeowners source notes fraud has been estimated at about 10% of incurred property/casualty losses, equal to roughly $37 billion in 2018 to 2019 (Insurance Information Institute factbook). Leakage also includes expense overruns and claim handling slippage. That means two portfolios can have the same expected loss and still generate very different profit outcomes.
A portfolio is rarely dangerous because of one dimension alone. The real challenge is how frequency, severity, accumulation, and leakage interact under stress.
For a quick way to map risk categories across lines, this overview of types of risk in the insurance industry helps frame the distinctions without collapsing them into one bucket.
How Actuaries Model Risk Variation
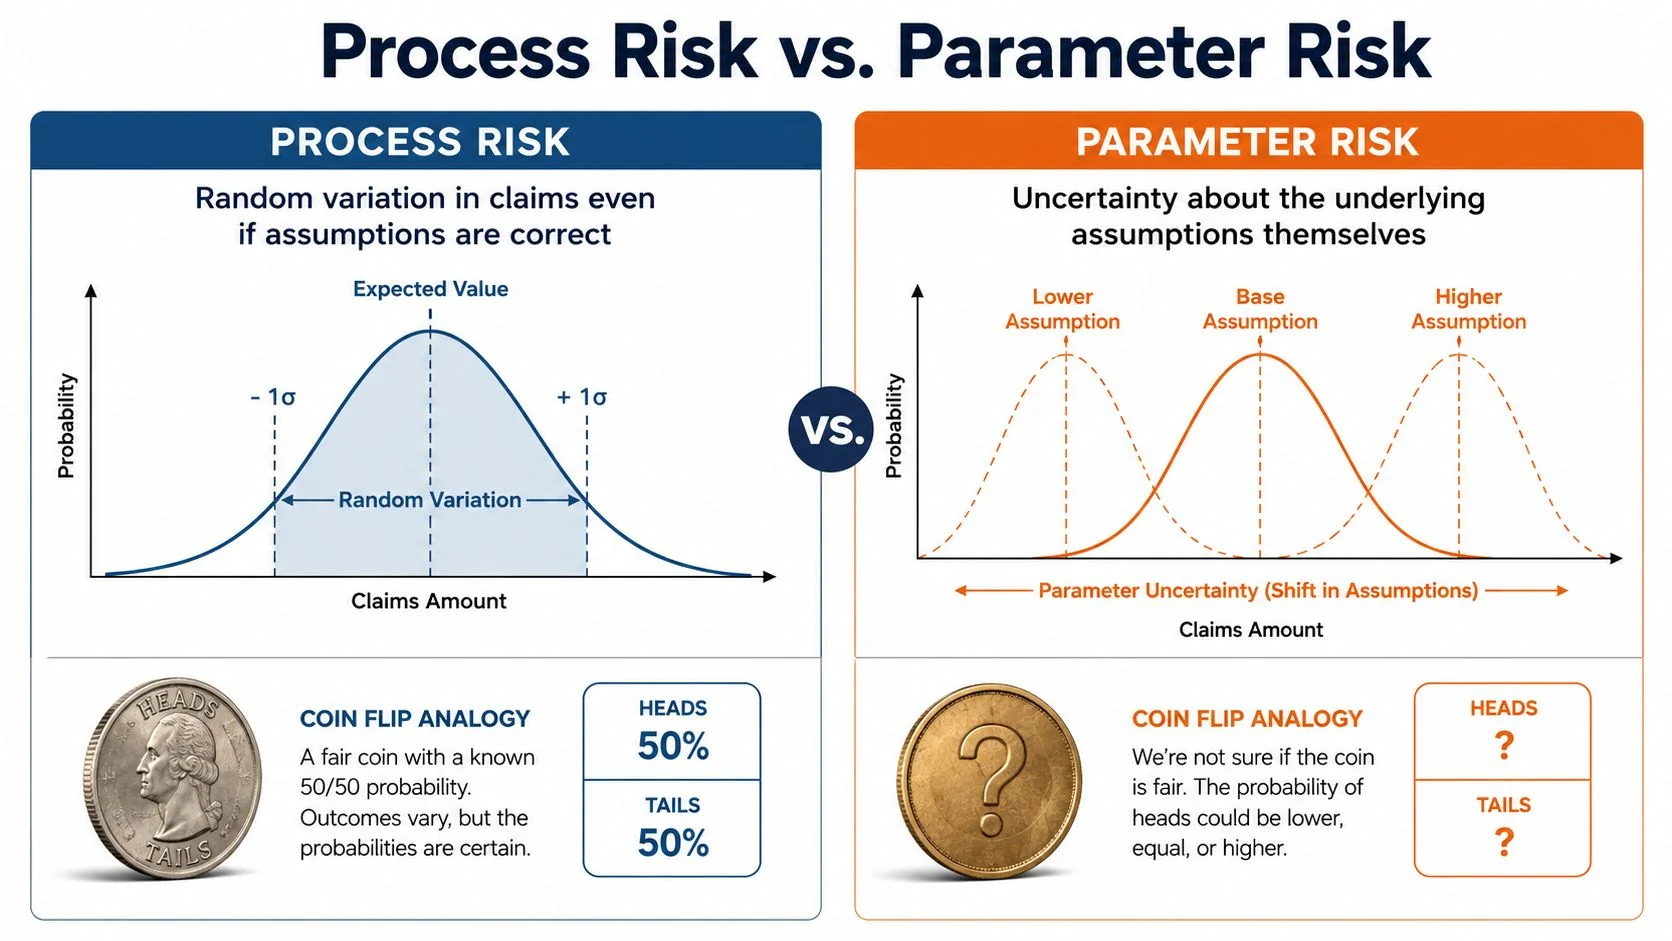
Actuaries care about variation because expected value is never the whole story. A claim model can be correct on average and still be wrong in practice if the realized losses swing too far from the mean. That's why the technical language separates process risk from parameter risk.
Process risk is randomness you can't wish away
Think of a coin toss where the coin really is fair. You still won't get exactly half heads in a small sample. That's process risk, the random variation in claims even when your model assumptions are right. It's built into the distribution itself, which is why insurers pool policies and diversify exposures.
The actuarial teaching note on variation is blunt about this point, risk is measurable as variation around expected outcomes, and larger variance or standard deviation means greater risk (SOA teaching material). So even a well-specified book of business can miss the expected value in a bad year.
Parameter risk is uncertainty about the model itself
Now change the coin example. Suppose you don't know whether the coin is fair, or worse, the coin's bias changes over time. That's parameter risk. In insurance, it shows up when the actuary selects the wrong distribution, when the portfolio shifts, or when the underlying environment changes faster than the model can adapt.
That distinction matters in practice. Process risk is handled with pooling, diversification, and capital. Parameter risk requires better data, validation, stress testing, and conservative margins. If your assumptions are unstable, more pooling won't fix the model error.
A data scientist building a pricing model should treat these as different failure modes. One is randomness around the mean, the other is uncertainty about the mean itself. If you blur them together, you'll misread the confidence you should place in the model output. For a broader technical lens, the discussion of predictive ML in insurance is useful because it highlights how model uncertainty becomes a business issue, not just a statistical one.
From Risk Measurement to Underwriting Decisions
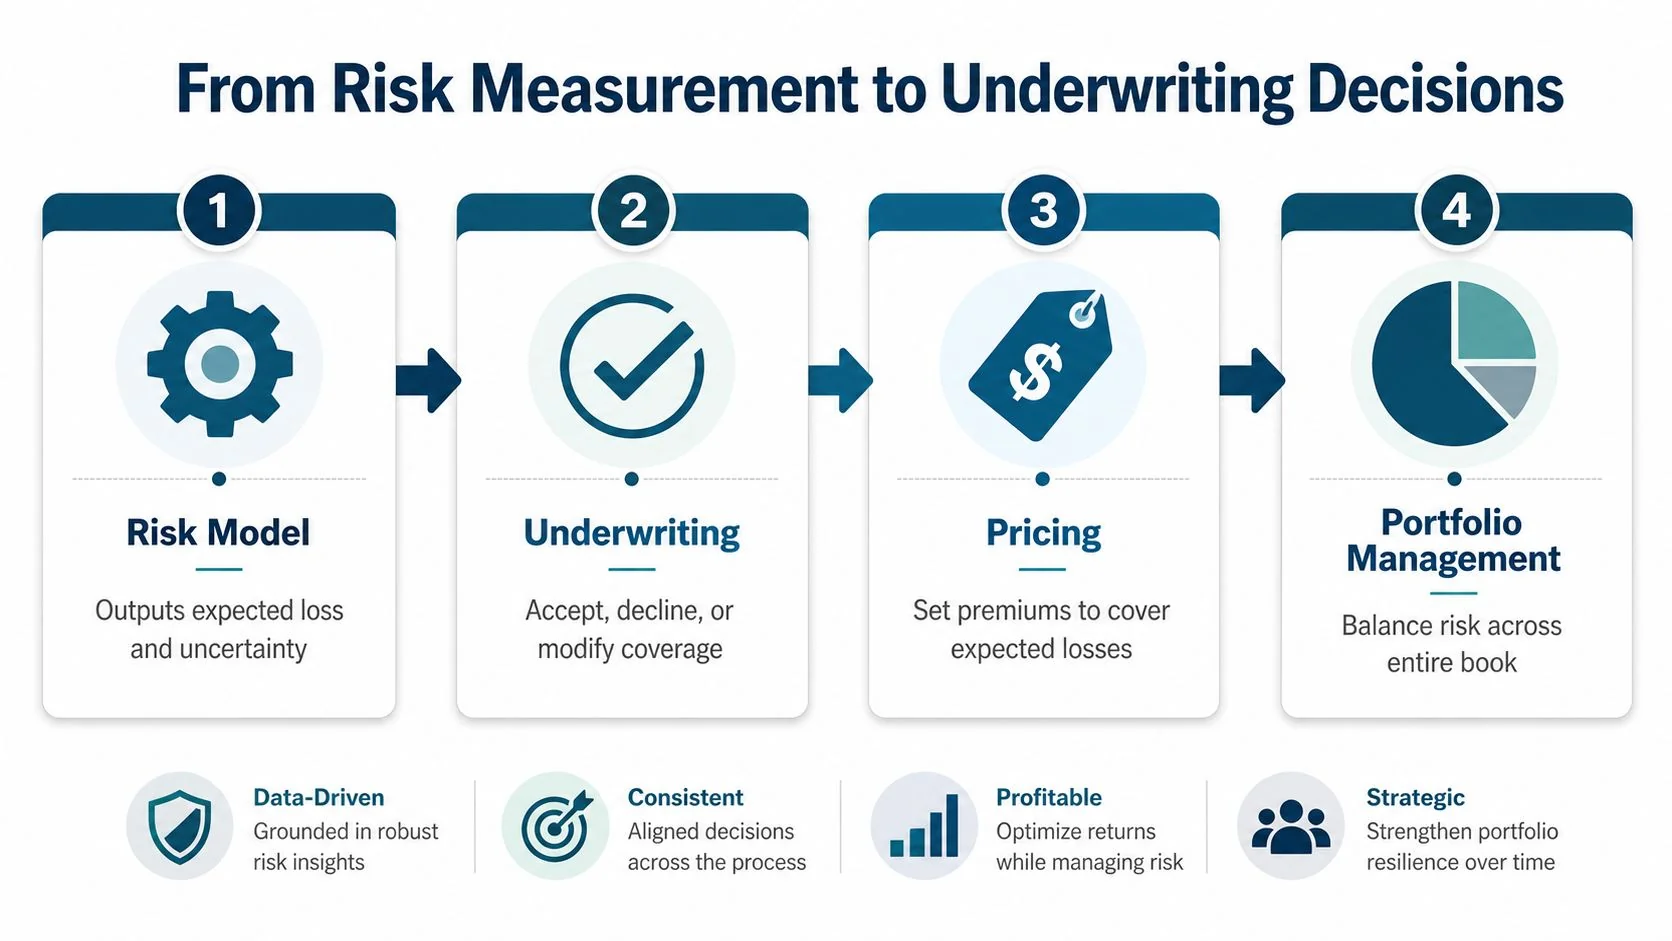
Risk measurement matters because it feeds decisions, not just reports. A strong model should end in an underwriting action, a price change, or a capital decision. If it doesn't change behavior, it isn't doing real insurance work.
The same risk logic drives different business choices
In property catastrophe, the response to high accumulation risk may be tighter underwriting, higher deductibles, or more reinsurance. In auto liability, a claims pattern with more frequent smaller losses may push pricing discipline and claims leakage control. In life mortality, the focus shifts toward long-run consistency in assumptions and data quality because the timing of losses is different even when the logic of uncertainty is the same.
The FCA's framework treats insurance risk as an operational concept for capital modeling, reserving, and control design, not a vague business intuition (FCA handbook). That matters because regulators need insurers to show how risk measurement connects to governance, not just how it looks in a spreadsheet.
Underwriting, pricing, and reserving each answer a different question
Underwriting asks whether the insurer should accept the risk, decline it, or change the terms. Pricing asks what premium covers the expected loss plus a risk margin. Reserving asks how much capital or provision is needed if experience comes in worse than planned.
Useful discipline: If the underwriting file, the pricing model, and the reserving view don't tell the same story, the portfolio probably needs another look.
That's also why contract design matters. A deductible, a limit, or a participation clause can shift risk between insurer and policyholder without changing the underlying hazard. For teams looking at operating workflow, underwriting software in insurance is a reminder that process design has to reflect the way risk is measured.
When Risk Becomes Uninsurable or Underserved
Not every difficult risk is uninsurable. Sometimes the issue is that the market doesn't have enough information, enough premium volume, or enough trust to price the risk cleanly. That's where the distinction between uninsurable and underserved matters.
The problem is often pooling, not the hazard itself
Insurance works because losses are shared across a pool. If the pool is too small, too correlated, or too poorly observed, pricing becomes unstable even when the hazard is real. That's why underserved markets can exist when coverage is limited, unaffordable, or poorly suited due to weak data, low premium volume, or historic bias in classification (InsurerBrain underserved market definition).
The practical implication is simple. Some groups aren't uninsured because the risk is impossible to cover. They're uninsured because the system can't pool them confidently at a price they can support.
Data gaps change who gets served
Life insurance shows this clearly in the industry discussion around mortality data. If a population lacks reliable experience data, pricing and product design become harder than for mainstream segments. The same issue appears in auto insurance through uninsured-motorist exposure, where access problems show up in the composition of the market rather than in the hazard alone (InsurerBrain underserved market definition).
That's where product design and classification matter. Better segmentation can expand access without forcing the insurer to ignore risk. The goal isn't to pretend all groups are identical. It's to model them fairly enough that coverage can be offered on sustainable terms.
Bottom line: Underserved doesn't automatically mean uninsurable. It often means the market hasn't built a pool, a dataset, or a contract form that fits the risk well enough.
Emerging Risks Reshaping the Landscape
The 2026 version of insurance risk looks different because the losses now arrive through channels that older models struggle to capture. Climate, cyber, social inflation, and gig-economy shifts all make risk harder to estimate with historical patterns alone. They also change who holds the risk, institutions or individuals.
Climate and cyber create new accumulation patterns
Climate risk changes both frequency and severity expectations, but it also changes accumulation. A single weather event can hit many policyholders at once, which is why catastrophe exposure can no longer be treated as a rare edge case. The catastrophe data earlier in the article show the scale of that shift in a concrete way (NAIC natural catastrophe risk dashboard report).
Cyber risk behaves differently but creates a similar modeling challenge. One event can affect many insureds through shared systems, vendors, or infrastructure. That means loss correlation matters as much as raw probability.
Risk is becoming more individualized
The broader market is also changing because risk is moving from institutions to individuals. Gig work shifts income volatility onto households. Chronic health conditions can make premiums harder to sustain. Underinsurance remains a live issue when assets at risk are not fully covered, which means the market sometimes prices exposure poorly rather than pricing “too much” exposure (Moody's view on the major risks shaping insurance today).
Technology is improving the ability to measure and segment previously hard-to-model groups, but it creates fresh questions about fairness and privacy. Better signals can sharpen underwriting. They can also amplify concerns if the market uses them without clear governance.
The right conclusion isn't that emerging risks are unmanageable. It's that the old habit of treating insurance risk as a static frequency-severity problem no longer fits the market. Today, the insurer has to think about model refresh, data provenance, and whether the portfolio is mispriced, underinsured, or both.
A Practical Framework for Evaluating Insurance Risk
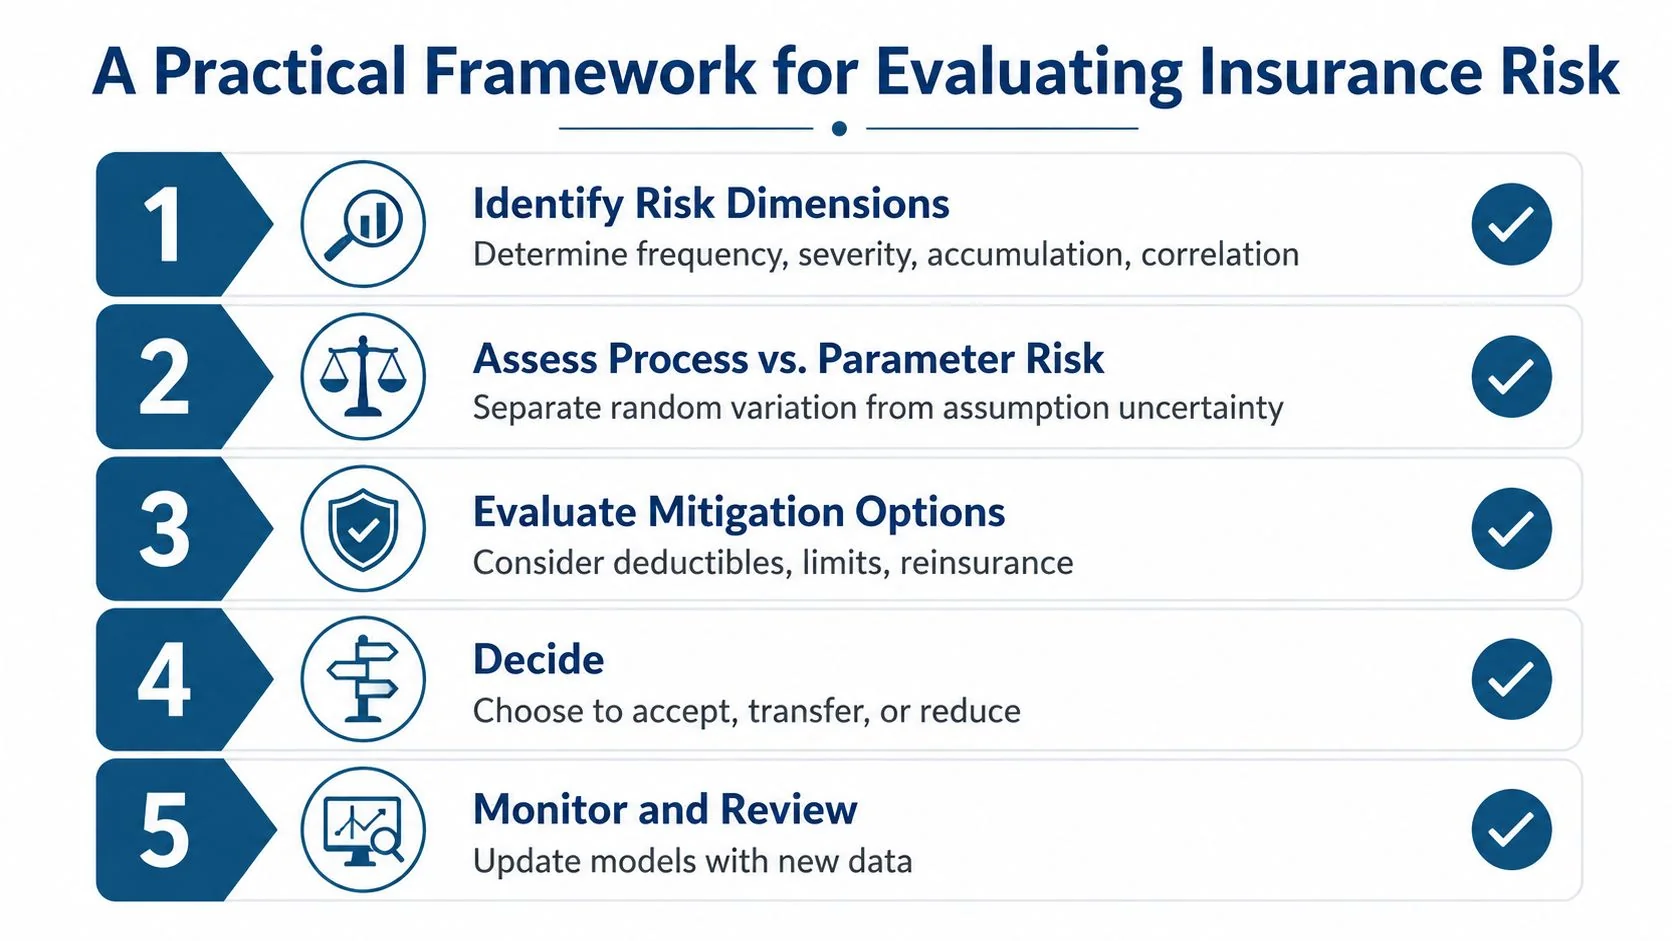
A useful risk review doesn't start with a loss ratio. It starts with a map of the uncertainty you're taking on. If you can name the risk dimensions, separate randomness from model error, and check how well the pool spreads losses, you'll make better decisions.
A working checklist for underwriters and modelers
- Identify risk dimensions. Ask whether the portfolio is driven by frequency, severity, accumulation, or leakage.
- Separate process from parameter risk. Decide whether the main issue is random variation or uncertainty about the assumptions themselves.
- Evaluate pooling options. Look at deductibles, limits, reinsurance, and how much correlation the book carries.
- Check data quality. Verify whether the model has enough credible history and whether the exposure mix is stable.
- Review market access. Ask whether the risk is uninsurable or underserved because the pool is weak.
That checklist works because it moves from description to action. It tells an underwriter what to ask, and it tells a data scientist what to stress test. It also keeps regulators, pricing teams, and reserving teams aligned on the same underlying exposure.
The point of all this comes back to the opening loss data. When insurers measure risk well, they can absorb shocks like the $99 billion in insured losses seen in 2024 and keep capital available for the next event (NAIC natural catastrophe risk dashboard report). If you want a deeper workflow for turning those ideas into internal process, use the risk framework in your own book review, then compare it with the research and practical resources at AI for Insurance.
