Risk Management in Insurance Business: A Practical Guide
Learn how risk management in insurance business works across underwriting, capital modelling, and AI monitoring, with practical frameworks for insurers.
Written by AI for Insurance
By the end of 2024, total insurer assets had grown 3% to about $42 trillion, while the global reinsurance market reached $1.75 trillion in gross reinsurance premiums, according to the International Association of Insurance Supervisors market report. Those figures reframe risk management in insurance business. The discipline isn't limited to declining bad risks or settling claims efficiently. It protects underwriting margins, capital strength, investment portfolios, data quality, operating systems, and the insurer's ability to respond when assumptions fail.
A useful way to learn the subject is to follow the path a risk takes. An underwriter accepts exposure, an actuary estimates its cost, finance assesses its effect on capital, claims teams provide emerging experience, and risk leaders decide whether the exposure remains within appetite. The strongest programs connect those decisions instead of allowing each department to build a separate view of reality.
Table of Contents
- Why Risk Management Matters in Insurance Today
- The Core Functions of Insurance Risk Management
- Key Risk Categories Every Insurer Must Track
- Capital Modelling and Solvency Frameworks
- Catastrophe Models, Property Data, and Governance Gaps
- AI-Enabled Monitoring and Emerging Technology Risks
- Enterprise Risk Management in Practice
- Bringing It All Together With a Practical Checklist
Why Risk Management Matters in Insurance Today
A motor insurer accepting a new fleet policy must decide whether the premium covers expected claims, expenses, capital usage, reinsurance costs, and the possibility of several accidents in one month. A technically sound price can still leave the insurer exposed if the portfolio accumulates similar vehicles, locations, or drivers.
That decision extends beyond underwriting. Insurers also manage invested assets, reinsurance recoverables, liquidity, technology, third parties, regulatory obligations, and climate-related exposure. The aggregate systemic risk score for the insurer pool fell 1.2% between year-end 2023 and year-end 2024, while 22% to 46% of insurers' general-account assets were exposed to climate-related risks, depending on region. These figures appear in the IAIS market analysis, showing why balance-sheet resilience belongs inside the risk function.
Risk management is an operating discipline
A claims department may control leakage yet create reserve problems if changing settlement patterns reach reserving teams too slowly. An investment team may improve yield while increasing solvency pressure if duration and credit exposure are assessed separately from liability behavior. Risk management connects these operating decisions before a local issue becomes a balance-sheet problem.
The practical questions are linked:
- Underwriting: Which risks can the insurer accept, at what price, and within what concentration limits?
- Capital: How much financial resilience must support the portfolio under severe but plausible conditions?
- Operations: Can claims, policy administration, data, and controls continue functioning during disruption?
- Governance: Who can challenge assumptions, approve exceptions, and escalate a deteriorating indicator?
A pricing model can be accurate and still mislead if property locations are incomplete, catastrophe zones are misclassified, or model changes lack documented approval. The same principle applies to AI. A fraud model may identify suspicious claims quickly, but weak training data, unexplained overrides, or poor monitoring can create unfair decisions and operational risk. Sound risk management therefore includes model governance and data quality, not only capital calculations.
Solvency regulation has made these questions more formal. Solvency II, introduced across the European Union in 2016, established risk-based capital rules and public reporting. Capital ratios provide an important reference point, but managers still need to test the assumptions behind them and understand how exposure changes under stress.
Practical rule: A risk report is useful only when a named decision-maker knows what action follows from a breached limit, deteriorating indicator, or changed assumption.
Post-pandemic underwriting resets, climate volatility, and closer supervisory attention have increased the cost of disconnected decisions. A modern risk lead connects underwriting basics with capital modelling, catastrophe data hygiene, AI-related fraud channels, and enterprise risk management.
The Core Functions of Insurance Risk Management
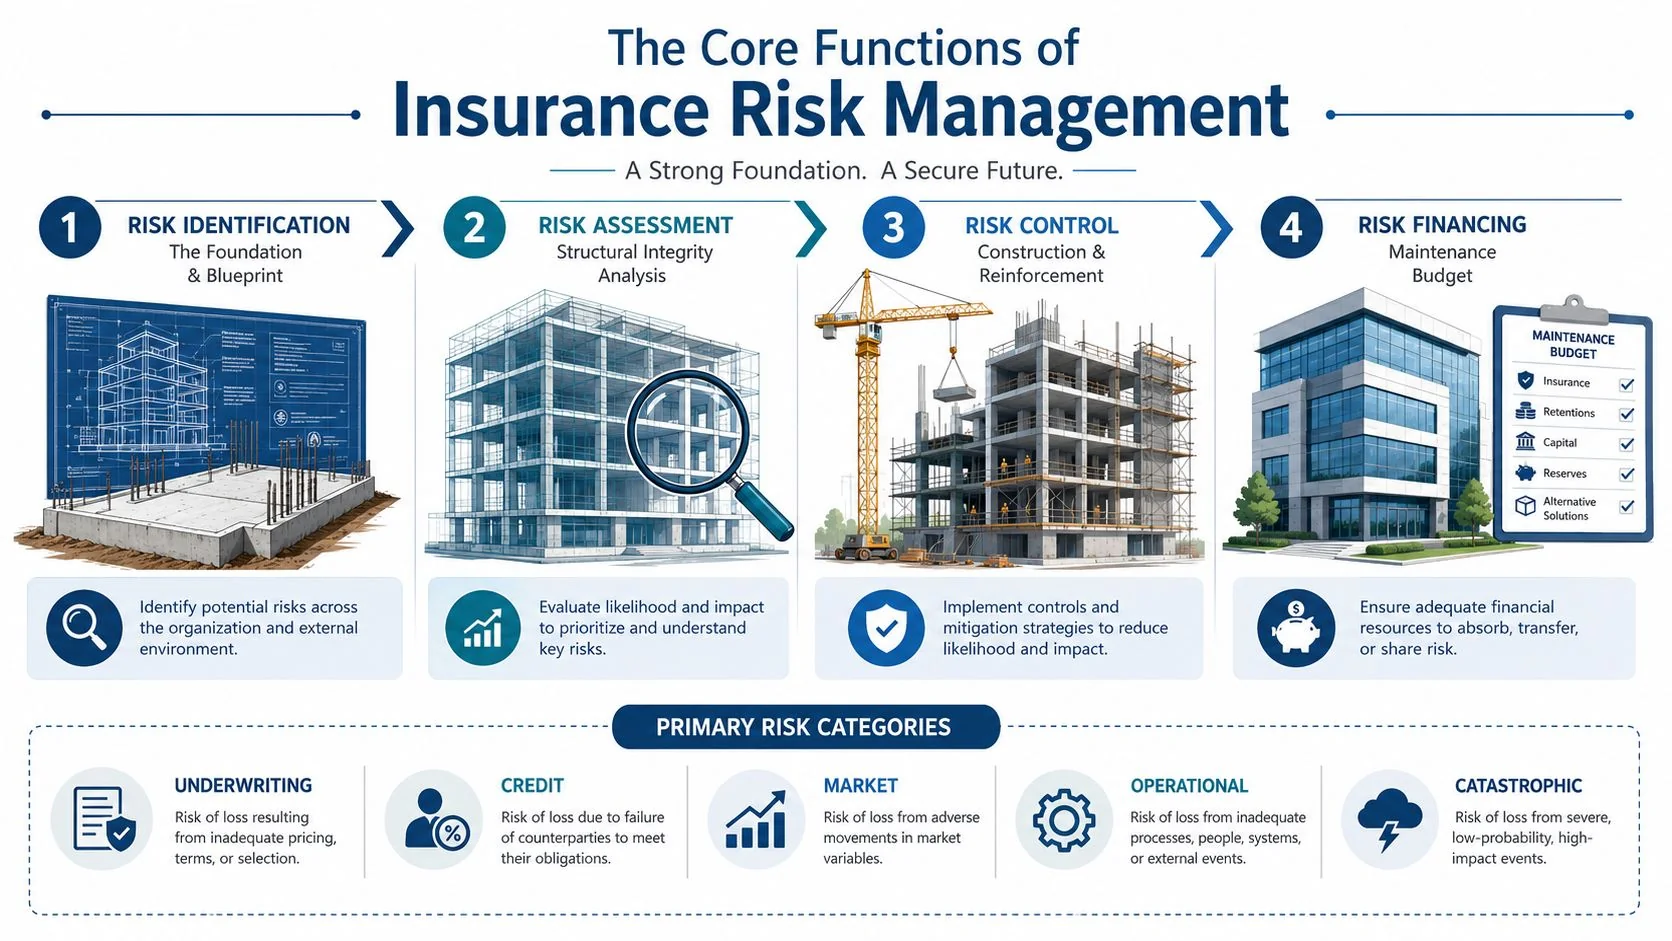
The four core functions of insurance risk management, risk identification, risk assessment, risk control, and risk financing, form a continuous cycle. Identification finds where exposure enters the business. Assessment estimates its potential effect. Control reduces the exposure, while financing prepares the insurer to retain or transfer losses.
Start with identification
Identification goes beyond listing named risks in a register. Teams should locate where exposure enters, record the assumptions behind it, identify amplifiers, and assign ownership. A commercial property register could include incomplete valuation data, geographic accumulation, claims inflation, reinsurer dependence, and concentrations of similar construction types.
Materiality assessment separates routine variation from threats that could affect capital, liquidity, customers, or operational continuity. A concise foundation is available in this guide to what insurance risk means.
Measure before choosing a response
Measurement combines actuarial analysis, scenario testing, stress tests, expert judgment, and financial projections. Its purpose is to show how results respond when frequency, severity, inflation, interest rates, counterparty strength, claims handling, or system availability changes. It does not require a perfect forecast.
Model governance makes the measurement usable. Managers need documented assumptions, approved changes, clean catastrophe and property data, and clear ownership of overrides. An advanced solvency model can still mislead if a location is missing or a hazard zone is wrong.
Monitor and control continuously
Monitoring converts assumptions into observable indicators. Dashboards may track loss ratios, reserve development, exposure concentrations, reinsurance recoverables, liquidity, model performance, complaints, system incidents, and exception volumes. Key risk indicators need thresholds, owners, review dates, and escalation routes.
Control measures reduce or finance exposure through underwriting authority limits, exclusions, deductibles, claims referrals, reinsurance, hedging, collateral requirements, access controls, and recovery procedures. AI-based fraud monitoring also requires checks on training data, overrides, and model performance. The chief risk officer connects these activities through the risk appetite statement, turning board tolerance into operating guardrails for underwriting, finance, claims, and technology.
Key Risk Categories Every Insurer Must Track
Risk categories are separate workstreams, but they share one balance sheet. A motor insurer might face deteriorating claims frequency, an investment portfolio might lose value after a market movement, a reinsurer might fail to pay, and a claims platform might become unavailable. Each event has a different owner and metric, yet all can reduce available capital or weaken customer service.
Underwriting risk begins at acceptance
Underwriting risk arises when actual claims differ materially from the assumptions behind acceptance and pricing. For example, a motor portfolio may experience higher frequency after a pricing model misreads repair costs or vehicle availability. In commercial property, incomplete building information can lead the insurer to accept fire, flood, or storm exposure at an inadequate price.
The control response starts with clear eligibility rules, segmentation, authority levels, referral triggers, and feedback from claims into pricing. Reserve risk belongs nearby, because an insurer can price new business appropriately and still suffer if prior-year claims are under-reserved.
Market and credit risks affect resilience
Market risk covers changes in interest rates, spreads, equity values, currencies, and other investment drivers. A long-duration asset portfolio may become less valuable when rates rise, while liability valuation and available capital also move. The risk team must therefore assess assets and liabilities together, not review investment performance in isolation.
Credit risk includes corporate bonds, banks, brokers, reinsurers, intermediaries, and other counterparties. A portfolio concentrated with a small group of reinsurance counterparties can create recovery risk if one becomes unable or unwilling to pay. Controls include exposure limits, collateral arrangements, counterparty reviews, and monitoring of settlement behavior.
Operational and adjacent risks are measurable too
Operational risk includes failed processes, system outages, poor change management, cyber incidents, data breaches, misconduct, and fraud. An automated underwriting rule can be exploited by a fraud ring if exception logic isn't monitored. A claims system outage can delay payments, increase manual work, and create customer harm even when the underlying insured losses are ordinary.
Climate, cyber, liquidity, legal, conduct, and strategic risks often cut across the primary categories. The key is to assign ownership and define how each risk affects underwriting, capital, service, and reputation.
| Risk Category | Example Scenario | Typical Owner | Key Metric |
|---|---|---|---|
| Underwriting | Pricing fails to reflect changing claims severity | Chief underwriting officer | Loss ratio, rate adequacy, concentration |
| Market | Asset values move against liability and capital assumptions | Chief investment officer | Market value sensitivity, duration gap |
| Credit | Reinsurance recovery becomes uncertain | Finance or reinsurance lead | Counterparty exposure, overdue recoverables |
| Operational | Claims platform outage disrupts settlement | Chief operations or technology officer | Availability, incident severity, recovery status |
| Catastrophic | Multiple locations suffer from one peril | Exposure management lead | Aggregate exposure, scenario loss |
For a broader classification, see this overview of types of risk in the insurance industry. The next management challenge is aggregation, because separate risk dashboards don't by themselves produce a solvency view.
Capital Modelling and Solvency Frameworks
A solvency ratio of 221% was the average for EU insurance groups in 2023, according to the IAIS Global Insurance Market Report. That figure provides context, not a target. A risk manager still needs to ask what sits behind the numerator, how stable the denominator is, and how quickly both could change after a severe event.
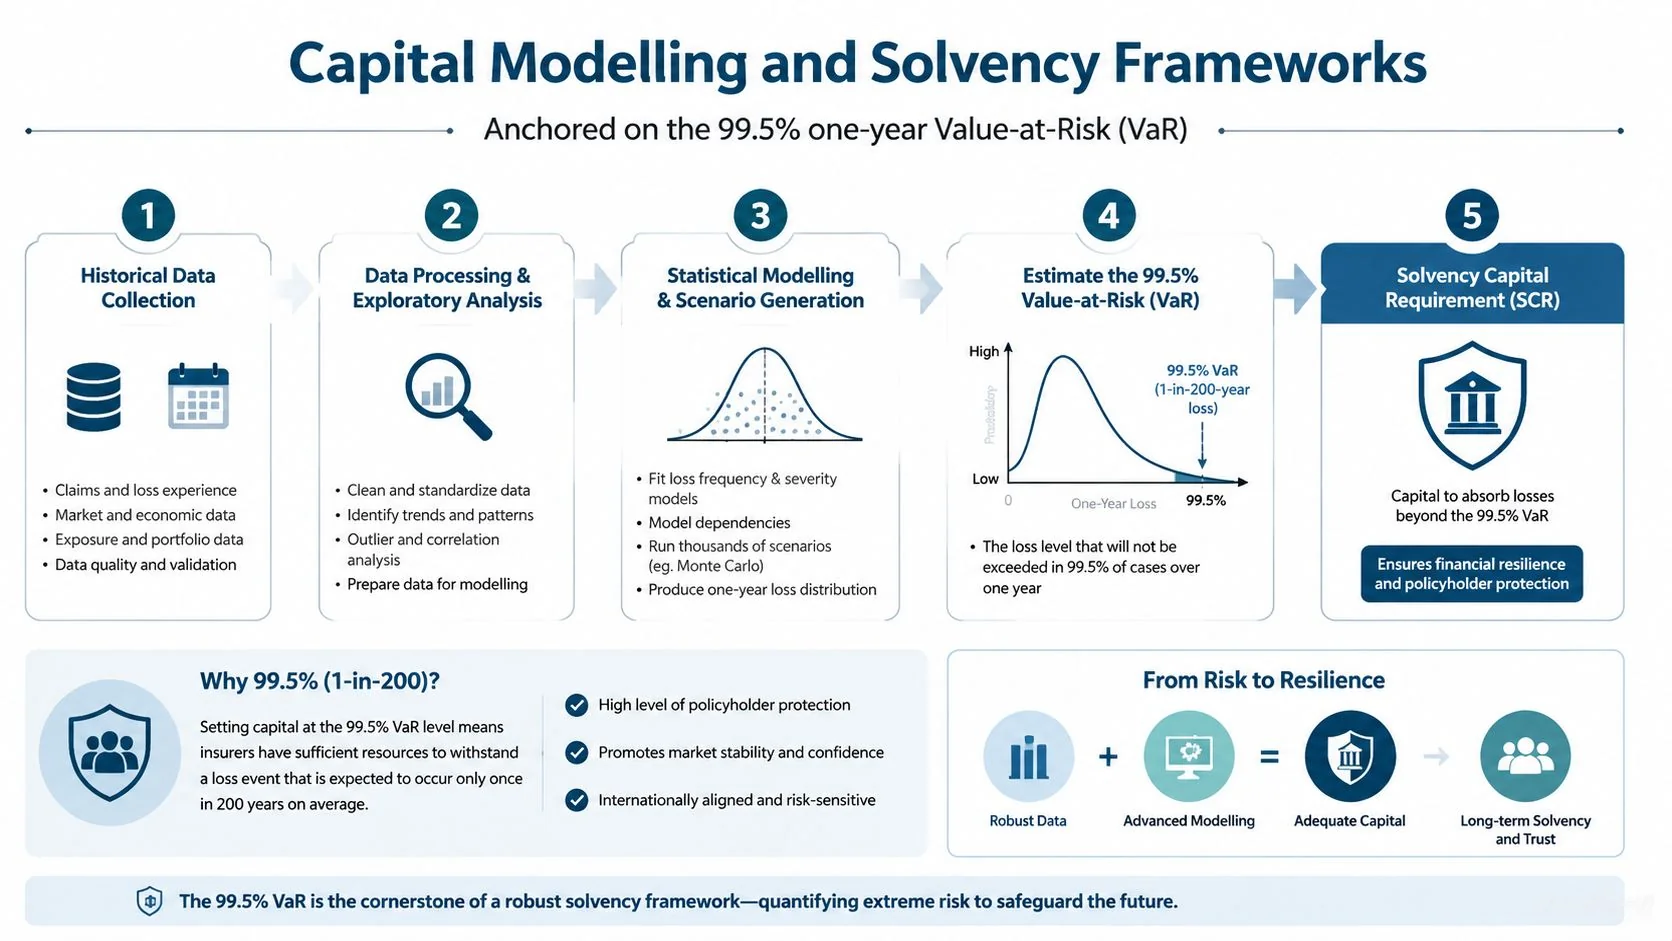
Capital modelling answers a practical question: how much loss-absorbing capacity does the insurer need for the risks it has accepted? Under Solvency II, the Solvency Capital Requirement is calibrated as a one-year value-at-risk at the 99.5% confidence level. The Minimum Capital Requirement is a lower intervention threshold intended to reflect about an 85% probability of adequacy over one year, as explained in this guide to the Solvency II standard formula.
Build the calculation in layers
The process starts with exposure, claims, asset, liability, and operational data. Actuaries and risk analysts model underwriting, market, credit, and operational risks in separate modules. Those modules are then aggregated through diversification assumptions and correlations. The result reflects the portfolio's combined profile, rather than just adding every standalone stress.
Model governance matters at each handoff. A changed claims definition, an incomplete asset file, or an undocumented correlation assumption can alter the capital result without any change in the underlying business. Reviewers should therefore record data owners, model versions, approval dates, validation findings, and the management decisions supported by each output.
The result is compared with eligible Own Funds:
Solvency ratio = eligible Own Funds ÷ Solvency Capital Requirement
If eligible Own Funds are 850 million and the SCR is 600 million, the ratio is 142%. This is arithmetic, not a reported market statistic. Management must still assess capital quality, input stability, stress results, and the speed at which the ratio could deteriorate.
Understand the limits of the ratio
A high ratio does not prove that risk management is effective. Weak exposure data, optimistic reserve assumptions, inappropriate correlations, or unchallenged model changes can make the result look safer than the business is. A standard formula supplies a consistent regulatory framework. An approved internal model can represent the insurer's portfolio more closely, but it demands stronger validation, documentation, controls, and supervisory approval.
The ratio is best treated like a dashboard warning light, not a full engine inspection. A falling result may indicate losses, market movements, reserve deterioration, weaker reinsurance recoveries, or a data and model change. The management response depends on identifying the cause, testing its persistence, and assigning an owner before the buffer becomes a breach. European and other market figures offer useful context, but company-level analysis determines whether the capital position can withstand the risks being written.
Catastrophe Models, Property Data, and Governance Gaps
Capital models are only as credible as the exposure data and assumptions behind them. Catastrophe models estimate how events such as hurricanes, earthquakes, floods, or severe storms could affect insured locations. If the address, occupancy, construction type, replacement value, or protection information is wrong, the output can misstate both individual risk and portfolio accumulation.
A property record with an incorrect location can place a building in the wrong hazard zone. An outdated construction classification can alter vulnerability assumptions. A missing secondary structure can understate the amount at risk. These are operational data failures, but they become actuarial, underwriting, reinsurance, and capital problems once the record enters a model.
The tooling gap is also a governance gap
A 2025 survey found that 48% of insurers didn't license catastrophe models and only 27% had dedicated teams to evaluate the models they used, while 68% said they were actively improving property data and location accuracy, according to this report on catastrophe risk management shortfalls. The implication is important. Buying analytics won't solve a program that lacks qualified reviewers, reliable location records, or decision rights.
An insurer should document which model applies to each peril and line of business, what assumptions are material, how vendor updates are assessed, and who can approve a change. Independent validation should test conceptual soundness, data lineage, implementation, sensitivity, and performance against observed experience. Back-testing can identify persistent divergence, but it can't prove that a rare event will behave exactly like historical events.
| Governance Gap | Required Control |
|---|---|
| Incomplete or stale location records | Ownership for address cleansing, geocoding, occupancy, and value updates |
| Model output treated as an unquestioned fact | Documented assumptions, sensitivity analysis, and challenge by qualified reviewers |
| Limited specialist capacity | A formal review plan covering material perils and portfolios |
| Vendor update adopted without impact analysis | Change control, comparison with the prior version, and approval evidence |
| Divergence between modelled and observed losses | Back-testing, root-cause analysis, and underwriting committee escalation |
The chief actuary should own actuarial appropriateness, the CRO function should oversee model risk and governance, and underwriting committees should decide how results affect appetite, pricing, and accumulation. For an example of how advanced simulation can support catastrophe analysis, review this case study on hurricane scenario simulation. The technology matters, but accountability remains a management responsibility.
AI-Enabled Monitoring and Emerging Technology Risks
AI should enter the risk conversation as a risk vector first and an efficiency tool second. Swiss Re's SONAR 2025 emerging-risk report flagged deepfake-driven disinformation as a driver of insurance fraud and cyberattacks. It also highlighted that AI and virtual assistance in healthcare can create new product liability and professional indemnity exposures.
Four exposure channels deserve separate controls
Fraud escalation is the most immediate concern for claims leaders. Generative systems can help fraudsters create synthetic documents, alter medical records, or imitate a claimant's voice during a call. That doesn't make every digitally submitted claim suspicious, but it does require stronger evidence checks, cross-channel verification, and escalation rules for unusual combinations of facts.
Identity proofing failures can occur during onboarding, policy changes, or claims payment. Deepfake content may defeat a control designed around a single image, recording, or automated interaction. Teams should combine independent signals and preserve an auditable reason for each referral.
Internal model risk arises when a pricing, claims, or fraud model relies on biased, stale, incomplete, or poorly labelled data. Performance can deteriorate after customer behavior, repair practices, medical patterns, or fraud tactics change. Validation must therefore test stability, fairness, explainability, drift, and outcomes across relevant segments.
Liability spillovers may follow when an AI supplier, insurer, healthcare provider, or professional uses an automated recommendation without adequate oversight. Product liability and professional indemnity questions can arise even when the system was designed to improve service.
AI-enabled monitoring provides a countermeasure. Natural-language analysis can flag inconsistencies in claims notes, anomaly detection can identify unusual submission patterns, and computer vision can support first-notice-of-loss triage. Each use case needs human override, documented decision logic, access controls, and a process for investigating false positives and false negatives.
AI doesn't remove the need for judgment. It changes where judgment must be applied, especially around data quality, escalation, and accountability.
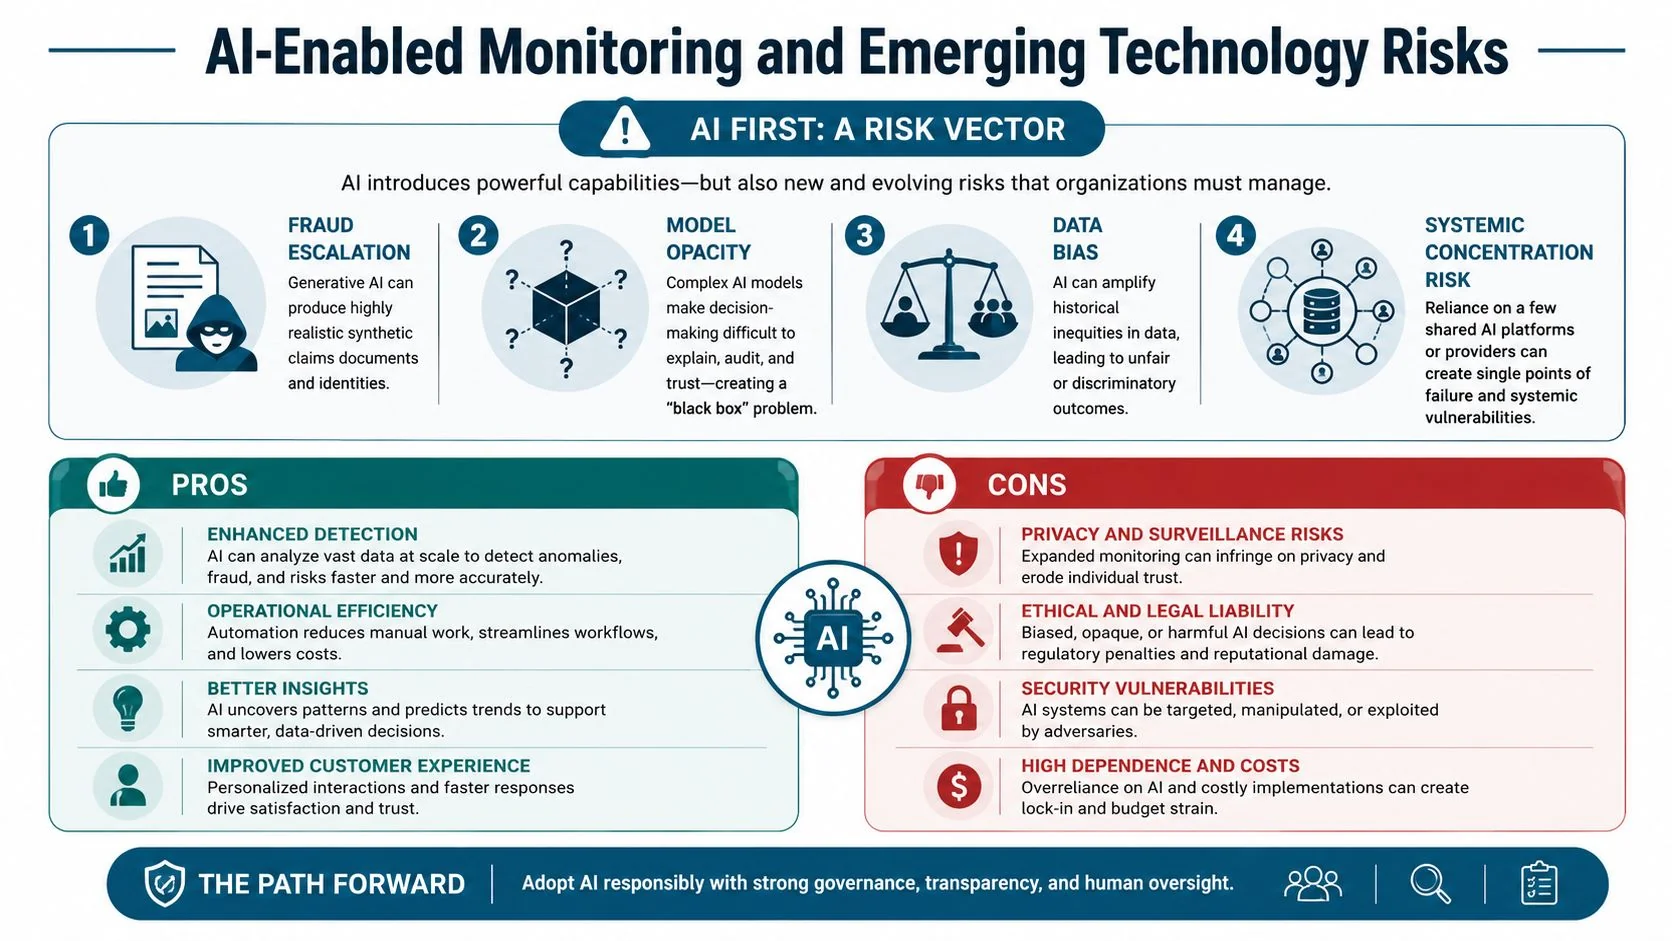
A short visual summary can help teams distinguish efficiency gains from new exposure channels.
<iframe width="100%" style="aspect-ratio: 16 / 9;" src="https://www.youtube.com/embed/NZb5l4atfl8" frameborder="0" allow="autoplay; encrypted-media" allowfullscreen></iframe>
Enterprise Risk Management in Practice
Enterprise risk management becomes useful when actuarial, claims, pricing, finance, underwriting, and technology teams work from a common reporting and control framework. Actuarial guidance emphasizes identifying, measuring, reporting, monitoring, and managing exposures, while also requiring attention to data quality, methodological consistency, and model governance in actuarial policy, as set out in this ERM guidance for actuaries.
A working ERM cycle
The cycle can begin with workshops involving underwriting and finance. Participants identify material exposures, assign owners, and record the assumptions that drive decisions. Key risk indicators then feed a consolidated register rather than remaining in separate departmental files.
Board-approved appetite statements must become operational limits. A growth limit for a portfolio, a concentration threshold, a counterparty tolerance, or a model performance trigger should have an owner and an escalation route. Risk-control self-assessments test whether the control exists, operates consistently, and produces evidence.
Quarterly performance reviews compare pricing assumptions with claims experience, reserving views, capital outputs, and emerging indicators. Scenario tests examine how several lines of business could be affected by a shared event. When a limit is breached, the response may include referral, remediation, reinsurance action, portfolio restriction, model recalibration, or board notification.
Reconcile assumptions before capital notices
Consider a motor insurer whose pricing team expects attritional losses to stabilize while reserving sees continued deterioration in recent accident years. Claims managers may have early evidence of repair inflation or changing settlement behavior that neither model reflects. A unified ERM forum brings the assumptions together, tests the disagreement, assigns an owner, and decides whether pricing, reserves, capital, or underwriting rules need adjustment.
That process catches model drift while the issue is still operational. It also gives the board and regulator a traceable explanation of how management identified the problem, assessed its effect, and acted on it.
Bringing It All Together With a Practical Checklist
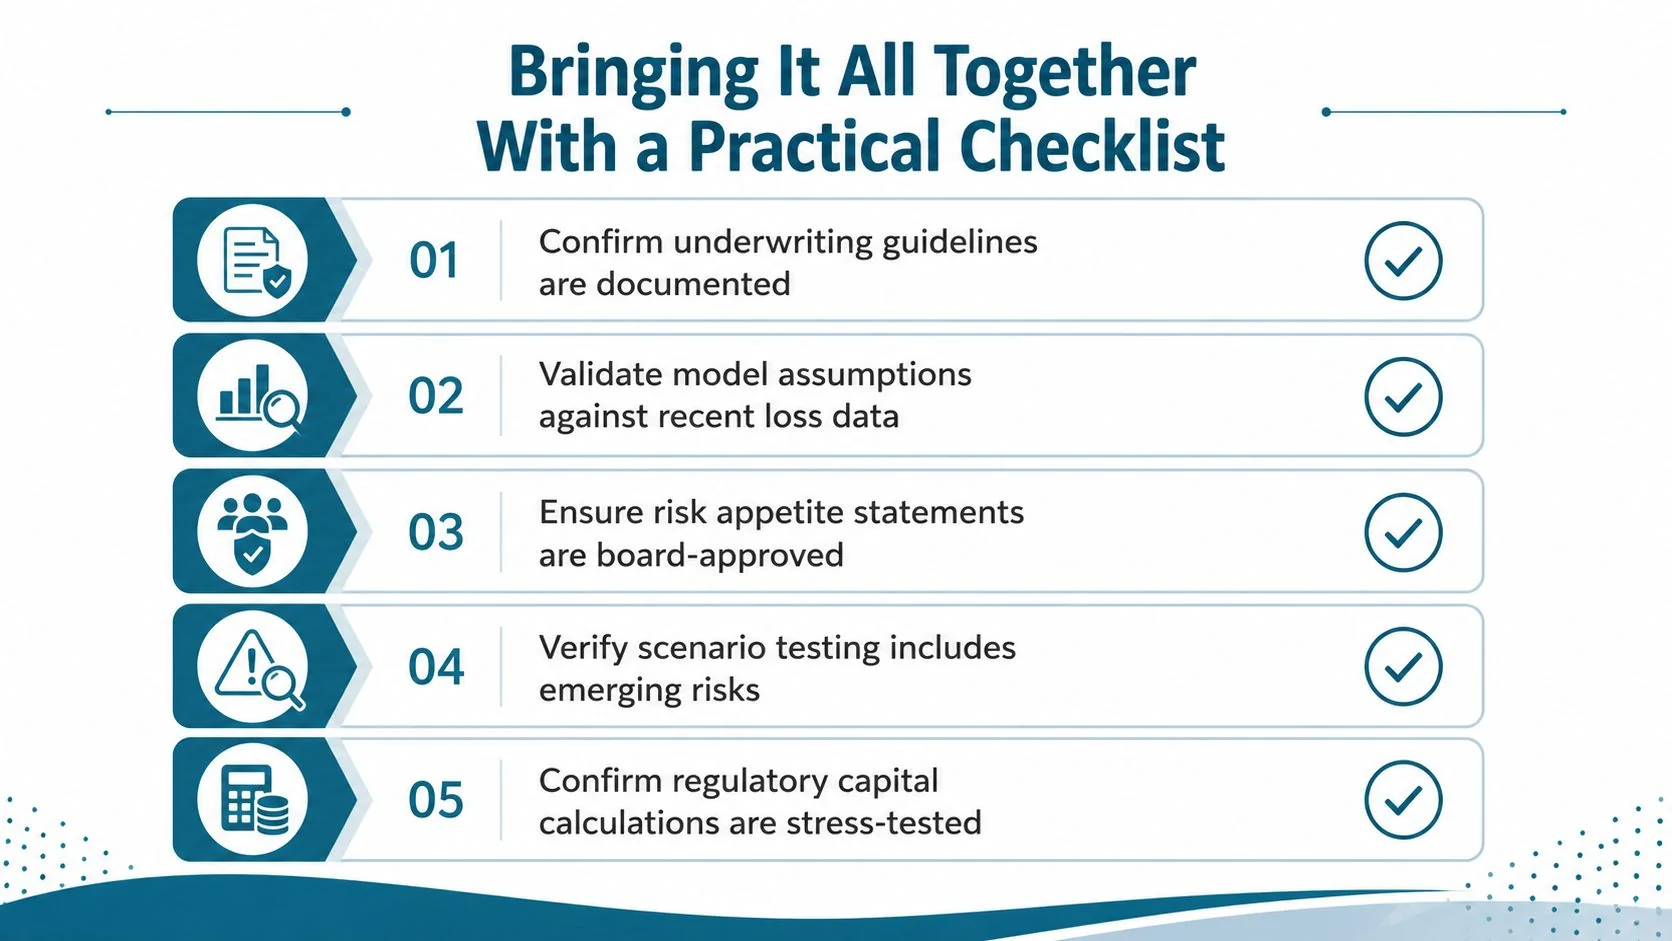
A strong risk management program doesn't rely on a single complex model. It depends on connected decisions, reliable data, clear ownership, and evidence that controls work under pressure. Use the following questions in a CRO review, board discussion, internal audit, or program redesign.
- Underwriting appetite: Are acceptance rules, pricing assumptions, authorities, exclusions, and concentration limits documented for each material portfolio?
- Capital model: Can the team explain how underwriting, market, credit, and operational risks feed the solvency calculation and how assumptions align with the 99.5% one-year VaR calibration described in the Solvency II framework guidance?
- Catastrophe data: Are location, occupancy, construction, protection, and value fields complete, current, traceable, and assigned to accountable owners?
- Model governance: Does every material model have validation, change control, performance review, documented limitations, and a named decision-maker?
- AI controls: Have fraud, identity, bias, explainability, vendor, and human-override risks been tested before an AI system influences underwriting or claims?
- ERM reconciliation: Do actuarial, claims, pricing, finance, underwriting, and technology teams compare assumptions through a shared register and escalation process?
- Scenario readiness: Can management show how emerging risks would affect customers, operations, liquidity, reinsurance, and capital?
The best next step is practical. Select one material portfolio, trace its data from submission to capital reporting, document every assumption and control owner, then compare the process with verified insurance AI implementations in the AI for Insurance searchable database. Use what you find to build a focused improvement plan for underwriting, claims, actuarial, and risk leadership.
