Predictive Analytics Insurance Guide to Smarter Pricing
Learn how predictive analytics insurance models improve pricing, churn and claims with real case studies, features and measurable outcomes.
Written by AI for Insurance
A commercial underwriter starts the morning with a crowded submission queue. Several applicants look similar on paper, yet their locations, construction details, prior losses, and operating patterns point to very different potential outcomes. The pressure is familiar: respond quickly, stay competitive, and protect the loss ratio without relying on intuition alone.
That's where predictive analytics in insurance earns its place. It doesn't promise perfect foresight, and it doesn't remove professional judgment. It helps teams rank risks, focus attention, set more consistent pricing rules, and identify cases that deserve deeper review. The practical question isn't whether a model can be accurate in the abstract. It's whether the model improves decisions, portfolio economics, and governance at the point where work happens.
Table of Contents
- Introduction to Predictive Analytics in Insurance
- How Predictive Analytics Works in Insurance
- Core Models and Features That Power Predictions
- Where Insurers Apply Predictive Analytics Today
- Measuring What Matters Beyond Accuracy
- From Model Lift to Business Impact and Governance
- Putting Predictive Analytics to Work With Confidence
Introduction to Predictive Analytics in Insurance
An experienced underwriter may notice that a combination of geography, occupancy, construction, and claims history deserves caution, even when no single factor looks alarming. Predictive analytics turns that kind of pattern recognition into a repeatable process. The model evaluates many variables together, estimates an outcome such as expected loss or claim severity, and gives the team a structured signal to support the next action.
That signal might move a submission into a preferred pricing tier, refer it to a senior underwriter, or allow a lower-risk file to follow a more automated path. The model isn't making a mystical prediction about one policy. It's helping the insurer distinguish groups of risks and allocate scarce underwriting capacity.
Practical rule: Treat a predictive score as a decision aid and portfolio signal, not as a guarantee about an individual policy.
The discipline has deeper roots than the current AI conversation suggests. The Society of Actuaries' predictive analytics timeline traces the history back to Richard Price's first life-insurance experience study in 1774. It also records the expansion of predictive modeling in the 1990s, when property and casualty insurers began using credit scores in personal-lines pricing, followed by broader external data use in the 2000s. Professional milestones included a CAS Predictive Modeling Seminar in 2006, life underwriting predictive model pilots in 2008, and a Society of Actuaries Predictive Analytics Symposium in 2017.
This history changes how insurers should frame the technology. Predictive analytics didn't replace actuarial thinking. It developed from actuarial experience studies, statistical modeling, and underwriting practice, then added more flexible methods and broader data. By the end of this guide, you'll have a practical way to connect the full chain: data becomes features, features become scores, scores become underwriting actions, and actions must be measured for both economic value and defensibility.
How Predictive Analytics Works in Insurance
Think of a skilled underwriter reviewing thousands of past files and gradually learning which combinations of characteristics tend to produce better or worse outcomes. Predictive modeling gives that pattern-recognition process a formal structure. Instead of relying on memory or inconsistent judgment, the insurer defines the outcome, prepares historical examples, trains a model, and applies the resulting score to new business.
The prediction loop
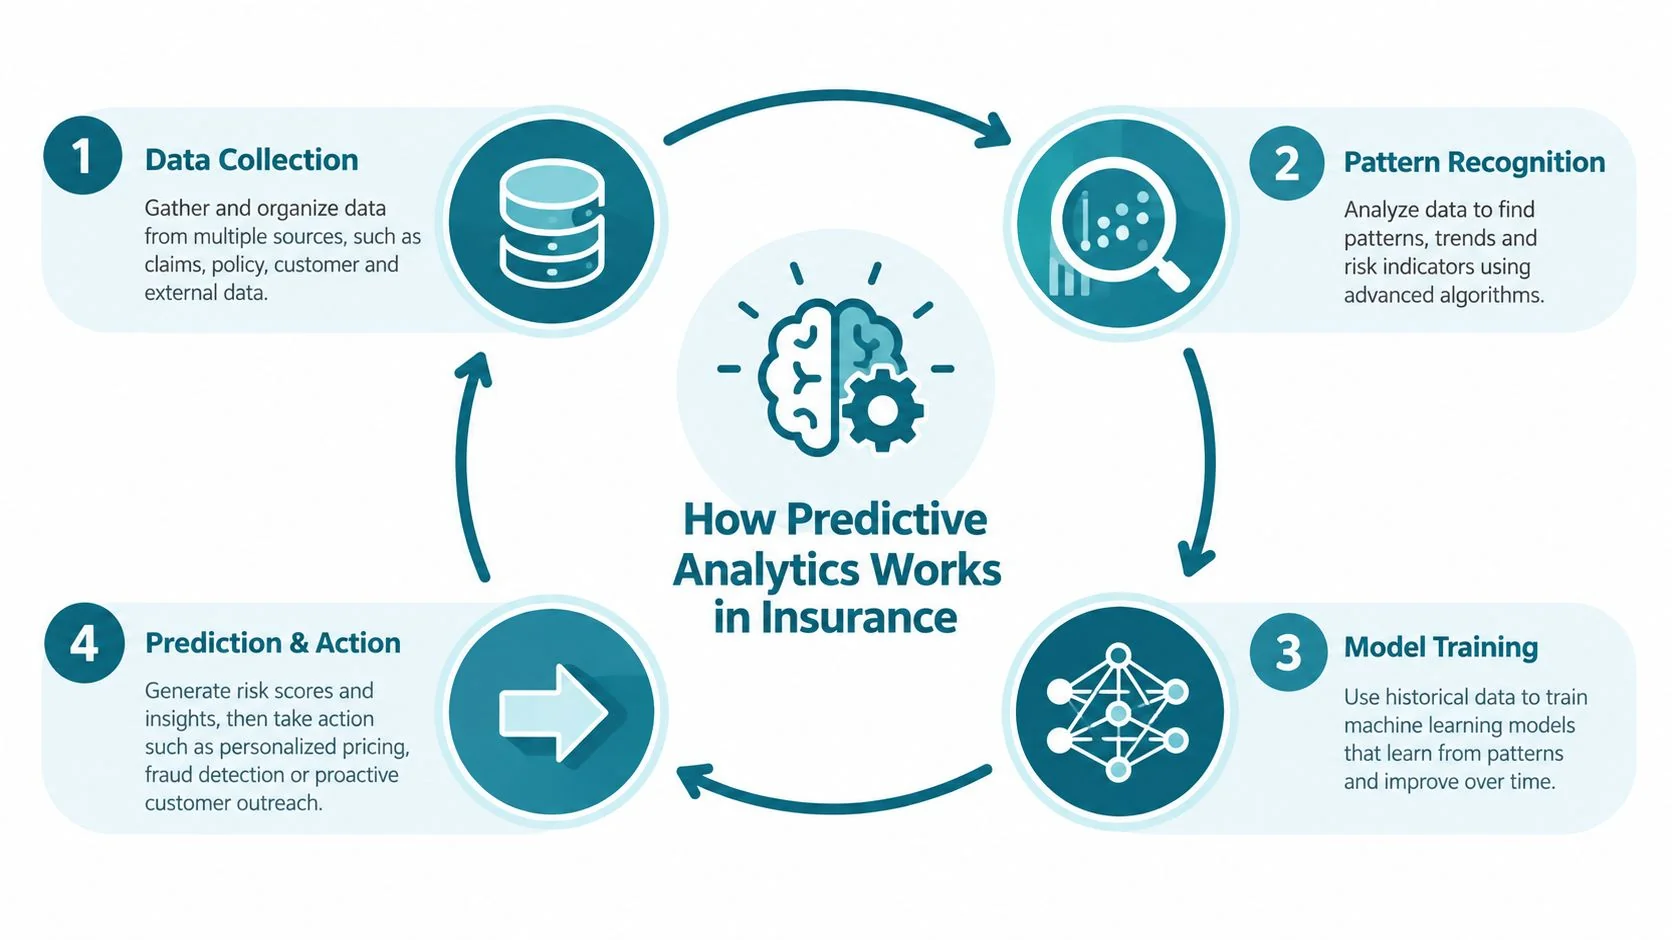
The workflow usually follows four connected steps:
-
Collect relevant data. The insurer brings together policy, exposure, claims, payment, property, customer, geographic, or operational information. Data must be usable and connected to the outcome being modeled.
-
Create meaningful features. Raw fields rarely tell the complete story. Analysts may transform dates, group related categories, measure prior activity, or combine variables so the model can recognize a more useful risk pattern.
-
Train and test the model. Historical records are used to estimate relationships between features and outcomes. Separate validation helps the team assess whether the model generalizes beyond the data used to train it.
-
Turn scores into action. A probability or expected-value estimate becomes a workflow rule, pricing tier, referral threshold, claims priority, or customer treatment. The analytics model directly impacts the economic outcomes.
Traditional actuarial tables and rating plans remain important. Predictive methods extend them by handling more variables and complex interactions, while established actuarial controls provide structure around assumptions, validation, and use. A model can be highly advanced and still fail if the data is poorly defined, the target is unstable, or the operational team doesn't know how to interpret the output.
The distinction between prediction and explanation also matters. A model may identify that certain characteristics are associated with higher expected loss without providing a simple causal story. Underwriters and actuaries therefore need both a useful prediction and a clear account of how the score is produced, constrained, monitored, and used.
This short visual overview can help teams build a shared vocabulary before discussing implementation details.
<iframe width="100%" style="aspect-ratio: 16 / 9;" src="https://www.youtube.com/embed/iMrO8SUcE20" frameborder="0" allow="autoplay; encrypted-media" allowfullscreen></iframe>
Core Models and Features That Power Predictions
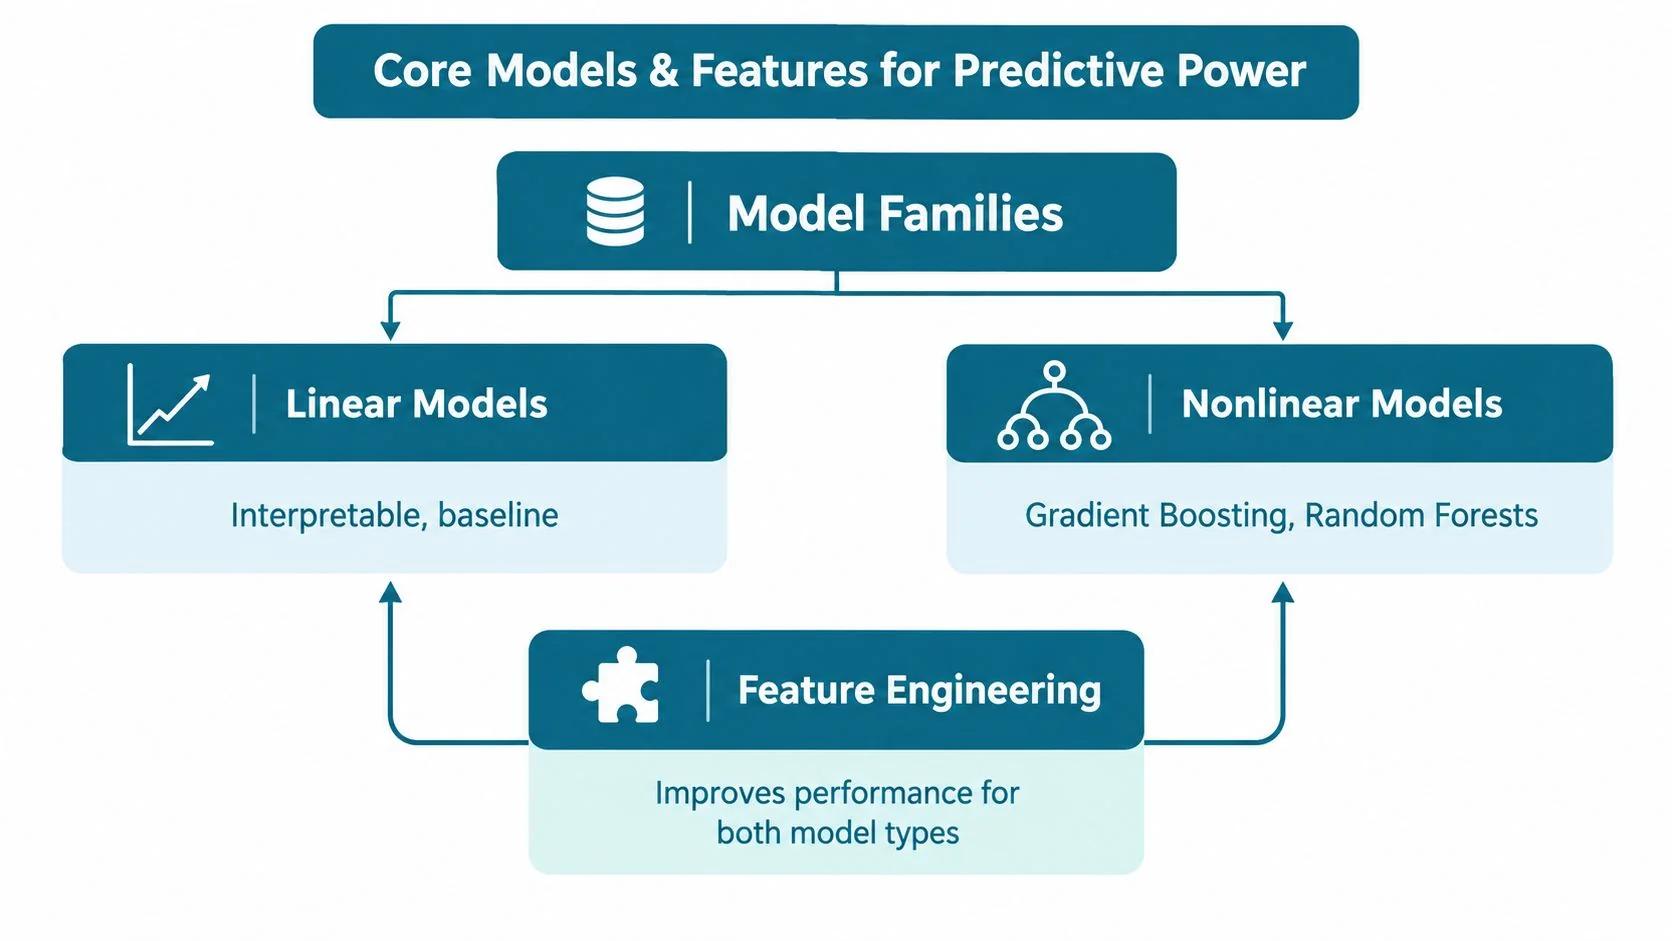
Model performance starts with the information supplied to the model. Feature engineering converts raw insurance data into variables that represent exposure, behavior, history, and context in a form an algorithm can use. A clean, relevant feature can matter more than choosing a more complicated algorithm.
Suppose a commercial property file contains a construction category, occupancy description, address, prior claim records, and inspection notes. Analysts might derive geographic risk groupings, loss frequency indicators, time since the latest claim, or relationships between occupancy and construction. The goal isn't to create as many variables as possible. It's to represent the risk in ways that are timely, stable, and defensible.
Why nonlinear models matter
Linear models remain valuable as baselines because their relationships are often easier to inspect and explain. They can show how an input is associated with an outcome under the model's assumptions. But insurance risk frequently depends on combinations of factors rather than isolated variables.
The Casualty Actuarial Society's predictive modeling guidance identifies gradient boosting, random forests, and neural networks as preferred approaches when prediction accuracy is the highest priority, because these methods can capture nonlinear interactions that linear models may miss. A location may be manageable for one occupancy but concerning for another. A prior loss pattern may mean something different depending on exposure size, policy age, or peril.
Features must connect to decisions
A score only creates value when an insurer knows what to do with it. Milliman describes predictive models as a basis for identifying stronger and weaker customer groups, creating rating tiers or surcharges, prioritizing submissions, and giving underwriters a workstation of variables and thresholds. In practice, that can produce a set of distinct actions:
- Prioritize review: Send high-risk submissions to experienced underwriters.
- Support straight-through processing: Allow low-risk files to move through a defined automated path when controls permit.
- Target pricing work: Review segments where predicted loss performance is above the portfolio target.
- Guide retention activity: Direct service or renewal attention toward customers with a meaningful risk of leaving.
The same principle applies across personal and commercial lines. Features may include policy and claims history, peril, geography, construction, occupation, customer interactions, or other approved data sources. Each feature needs a documented definition, a known availability date, and a clear reason for inclusion.
Data leakage is a common failure mode. If a model uses information that became available only after the underwriting decision, its apparent performance can be misleading. Analysts also need to examine missing values, changing data definitions, segment coverage, and whether a feature creates fairness or regulatory concerns.
Where Insurers Apply Predictive Analytics Today
The same analytical foundation can support very different insurance workflows. Pricing asks how much risk a policy represents, retention asks what a customer may do next, and claims triage asks where operational attention will have the greatest effect. The output may look like a score in each case, but the target, timing, and action differ.
| Use Case | Business Question | Typical Features | Model Output and Action |
|---|---|---|---|
| Pricing and risk selection | Which risks should the insurer pursue, refer, or price differently? | Exposure, claims history, geography, peril, construction, occupation, and approved external signals | Risk score, expected loss estimate, or segment ranking. Support pricing tiers, referrals, and portfolio selection. |
| Churn and retention | Which policyholders may cancel, reduce coverage, or disengage? | Policy tenure, payment behavior, service interactions, renewal activity, and customer responses | Retention propensity or priority score. Guide outreach, service intervention, or renewal strategy. |
| Claims triage and severity prediction | Which claims need rapid handling, specialist review, or early escalation? | Claim description, policy details, prior claims, damage indicators, coverage information, and historical outcomes | Priority, severity, or escalation score. Route work, allocate resources, and identify potentially complex claims. |
Pricing and risk selection
For underwriting, the important question isn't just whether the model predicts a claim. The insurer needs to know whether the score ranks risks in a way that supports pricing discipline. A commercial submission with a high score might receive senior review, while a lower-risk file could move through a simpler workflow, subject to the insurer's rules and controls.
A useful example is a dynamic pricing implementation documented in the AI for Insurance case study on machine-learning pricing. The relevant lesson is methodological: evaluate a use case by its disclosed implementation context and outcome, not by the label “AI” alone.
Retention and claims
Retention models support a different intervention. They should help teams decide who needs attention and why, rather than trigger indiscriminate discounts. Claims models can prioritize files, identify possible severity, or route cases to specialists. They don't eliminate adjuster judgment. They help place that judgment where complexity and potential impact justify it.
The economics depend on workflow design. A highly predictive model that produces no timely action has limited value, while a modest model embedded in a well-managed process can improve consistency and capacity.
Measuring What Matters Beyond Accuracy
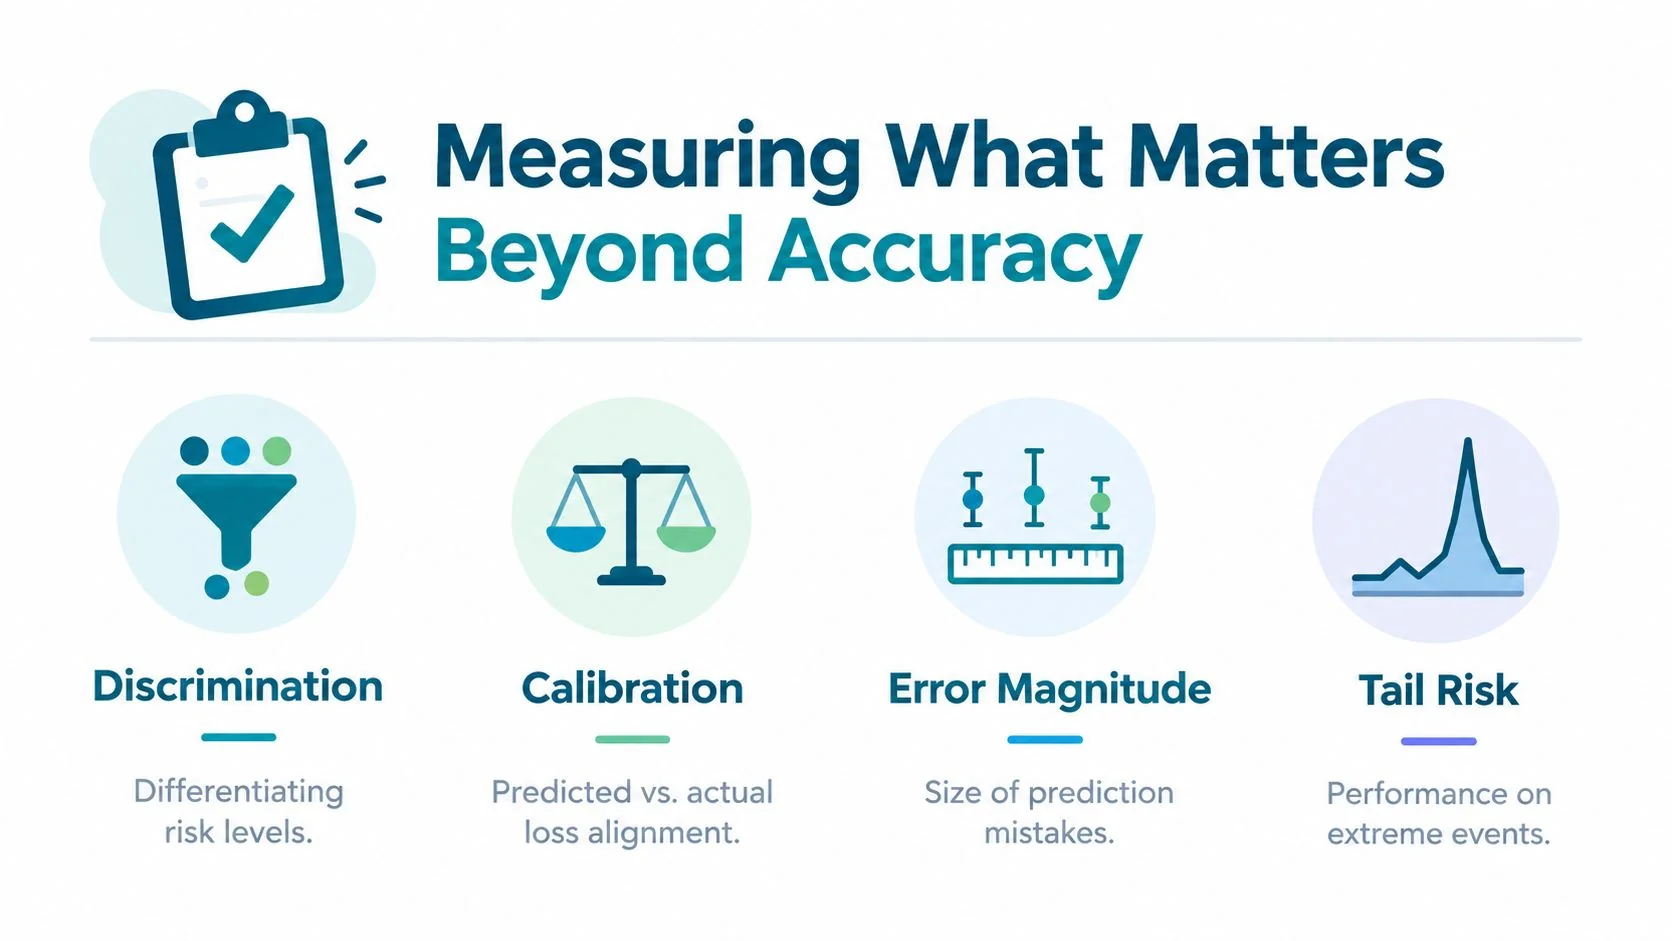
A pricing model can report strong average performance and still create serious portfolio problems. Insurance teams need to separate discrimination, calibration, error magnitude, and tail accuracy, because each dimension answers a different question.
- Discrimination: Can the model distinguish relatively higher-risk observations from relatively lower-risk observations?
- Calibration: Do predicted outcomes align with observed outcomes across relevant groups?
- Error magnitude: How large are the model's mistakes, and where do they occur?
- Tail accuracy: Does the model identify extreme-severity or catastrophe-prone segments adequately?
Ranking isn't the same as pricing
A model with strong AUC-like ranking may place risks in the right order while assigning poorly calibrated levels of risk. That distinction matters in insurance. If the model underestimates a tail segment, the insurer may apply inadequate pricing or fail to refer exposure that requires closer review.
The actuarial guidance on predictive analytics evaluation emphasizes discrimination, calibration, error magnitude, and tail accuracy as separate evaluation dimensions. It also recommends validating standard machine-learning measures alongside insurance-specific tools such as lift curves, Gini, and loss-ratio lift, then stress-testing extreme-severity segments before applying pricing or referral rules.
A practical validation view
Start with the business decision, then choose the validation evidence that supports it. A claims triage model may need reliable prioritization and severity calibration. A pricing model needs ranking quality, alignment between predicted and actual loss, and careful treatment of tail exposure.
Review results by line of business, geography, peril, construction, occupation, and other material segments. Segment-level drift checks can reveal that a model remains stable overall while weakening for a particular portfolio area. Periodic recalibration matters because the relationship between features and outcomes can change as behavior, exposure, underwriting appetite, and market conditions change.
For a broader explanation of the risk concepts behind these decisions, see this guide to insurance risk. The central discipline is simple: don't approve a model because one score looks impressive. Approve it when the evidence matches the decision the insurer intends to make.
From Model Lift to Business Impact and Governance
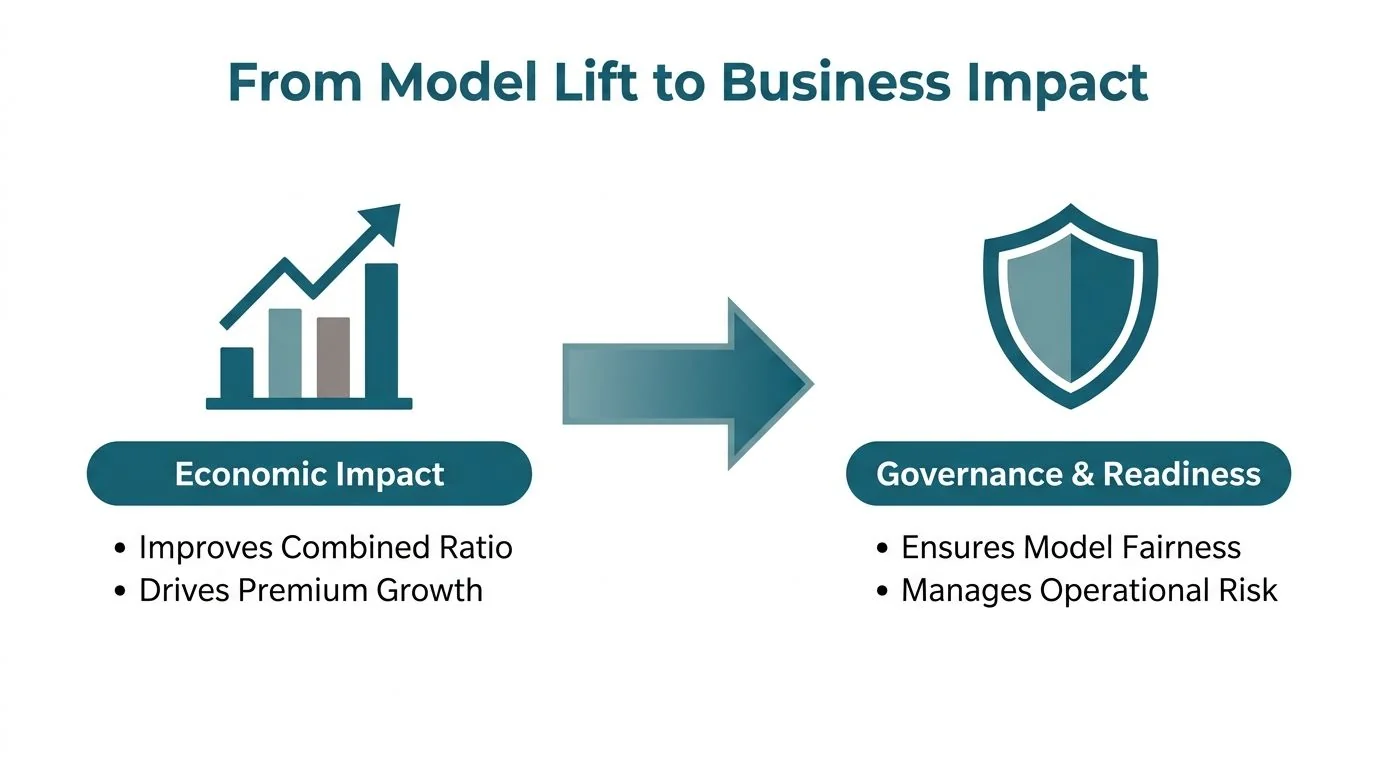
An underwriter receives two submissions that look similar on conventional measures. A predictive model ranks one as more likely to produce profitable business, but that ranking matters only if the insurer can translate it into a pricing, selection, or referral decision. Model lift is therefore an economic input, not the final result. Its value appears when improved separation supports pricing discipline, directs experienced staff to the right cases, or reduces avoidable claims and processing effort.
A WTW survey reported that North American and Canadian property and casualty insurers using more advanced analytics achieved combined ratios six percentage points lower and premium growth three percentage points higher than slower adopters between 2022 and 2024. The findings are summarized in Carrier Management's coverage of the WTW survey. The same source reported that almost all surveyed insurers use underwriting and pricing analytics for predictive rating models, while close to 80% rely on advanced rating and pricing models.
Adoption changes the value question
With analytics already common, the business advantage may come from smaller improvements rather than from introducing an entirely new capability. Better ranking can sharpen risk segmentation. Better calibration can keep indicated prices closer to observed loss costs. Faster execution can help underwriters apply those signals before capacity, appetite, or submission conditions change.
A useful business case connects each model output to a specific economic pathway:
- Which portfolio segment should change?
- Which underwriting or claims action follows the score?
- How might that action affect pricing, capacity, retention, or expense?
- What evidence would show that the effect persisted as conditions changed?
The model is like a sorting system. Ranking quality determines whether higher-risk accounts rise to attention, calibration determines whether the assigned risk level is proportionate, and workflow rules determine whether anyone acts on the result. If one link fails, a strong accuracy score may produce little improvement in the combined ratio.
Governance is part of the return
Governance readiness sits alongside performance as a deployment requirement. A 2026 actuarial industry article on predictive analytics underwriting reported that the NAIC Big Data and Artificial Intelligence Working Group is developing an AI Systems Evaluation Tool for regulatory examinations, with a pilot summarized in February 2026. It also noted that the Casualty Actuarial Society made its Property and Casualty Predictive Analytics requirement mandatory for all ACAS candidates effective January 1, 2026.
An insurer should be able to document the model's purpose, data lineage, development population, validation results, limitations, approval history, monitoring plan, and change controls. It should explain how the score affects a human decision, which overrides are allowed, how exceptions are recorded, and how drift or unfair outcomes are investigated.
A model that improves selection but cannot be defended creates operational risk. Auditability preserves the connection between prediction, pricing discipline, and measurable portfolio results.
Putting Predictive Analytics to Work With Confidence
A sensible implementation begins with a business decision, not a technology demonstration. Choose a workflow where the insurer can define the target, identify the available data, assign an accountable owner, and connect the output to a real action. A pilot should have a clear baseline and a monitoring plan before production use begins.
Use this decision checklist:
- Define the economic mechanism. State how the model should affect pricing, selection, triage, retention, expense, or capacity.
- Check data readiness. Confirm that fields are available at decision time, consistently defined, sufficiently complete, and legally permitted for the intended use.
- Test multiple dimensions. Review discrimination, calibration, error magnitude, tail behavior, lift, Gini, and loss-ratio lift where appropriate.
- Design the workflow. Specify referral thresholds, human review, overrides, escalation paths, and the actions attached to each score range.
- Prepare governance evidence. Maintain documentation for data lineage, model purpose, validation, fairness review, approvals, monitoring, and change management.
- Measure business outcomes. Track whether the intervention changes portfolio mix, pricing discipline, processing capacity, claims handling, or retention behavior.

Benchmarking can reduce guesswork. AI for Insurance provides a searchable database of documented insurance AI implementations, with filters for use case, industry line, and technology, plus case-study details such as disclosed implementation duration, throughput, error rates, and ROI-related metrics. Use an evidence base like this to compare relevant implementations by workflow and disclosed outcome, rather than comparing broad product claims.
For a large-scale modeling example, review the case study on a patented model factory scoring 25 billion models. The point isn't to copy another insurer's architecture. It's to ask which parts of the approach, evidence, and operating model apply to your own line of business.
Predictive analytics insurance initiatives succeed when model quality, underwriting action, economic measurement, and governance move together. Start with one decision, document the expected value, validate the tail, and involve underwriting, actuarial, data, compliance, and operations teams before the score reaches production.
If your team is evaluating a predictive analytics pilot, begin by documenting one target decision and its current baseline. Then use the AI for Insurance database to find comparable implementations, build a multi-metric validation plan, and assemble the governance evidence needed for a defensible production rollout.
