Insurance Underwriting Automation: A Practical 2026 Guide
Explore insurance underwriting automation in 2026. Learn decision automation, rules and ML triage, integration patterns, KPIs, and real outcomes
Written by AI for Insurance
AI touches only a small share of underwriting work today, yet senior executives expect it to touch most of it within three years. That distance between current use and stated intent is the most important fact in insurance underwriting automation right now. Closing that gap is not inevitable: a program will succeed or stall on data readiness, integration, and auditability, not on model selection alone.
Table of Contents
- Why Insurance Underwriting Automation Matters Now
- The End-to-End Underwriting Automation Workflow
- Rules Engines, Machine Learning, and Generative AI Compared
- Decision Automation Patterns by Line of Business
- Integration Patterns and the Data Bottleneck
- Governance, Fairness, and Contestability in Production
- KPIs That Connect Underwriting Automation to Profitability
- Building a 90-Day Underwriting Automation Roadmap
Why Insurance Underwriting Automation Matters Now
Accenture's 2025 study surveyed 430 senior underwriting executives across life, commercial property and casualty, and personal property and casualty in 11 countries, and found AI and generative AI were used in only 14% of underwriting activity, with executives expecting 70% within the following three years and tasks materially affected rising from 17% to 75%. That forecast covers ingestion, triage, risk assessment, pricing support, and decision preparation. It doesn't mean 70% of policies will be issued without human oversight.
European evidence points in the same uneven direction. In a 2024 McKinsey survey of more than 50 leaders from the largest European insurer groups, one-third already had initial generative AI use cases in production, only 20% classified their AI maturity as advanced, and 60% described their traditional data environment as evolving, while more than half anticipated productivity gains of 10 to 20%, premium growth of 1.5 to 3.0%, and technical result improvements of 1.5 to 3.0 percentage points according to McKinsey's survey of European insurer leaders. Those are executive expectations, not independently verified portfolio outcomes.
What the Gap Actually Means
Insurers now frame automation as a lever for pricing performance, growth, and underwriting profitability, not just back-office efficiency. That raises the standard for proof. A faster submission queue that misprices risk or can't explain a decline creates more value destruction than a slower manual process.
Analyst read: Treat adoption forecasts as a statement of strategic priority. Treat data maturity as the constraint that determines timing.
Underwriting Automation: Executive Expectations vs Reality
| Signal | 2024-2025 Reading | Implication for Automation Programs |
|---|---|---|
| Current AI use | Low share of activity, early to middle adoption | Start with bounded tasks, not autonomous judgment |
| Expected AI use | Broad task-level expansion within three years | Roadmap capacity, controls, and integration now |
| Data environment | Most respondents still evolving | Fund lineage, quality, and access before scale |
| Expected business effect | Productivity, growth, technical improvement anticipated | Require baseline and outcome proof, don't assume gains |
Underwriters and CIOs should read these surveys together. Appetite is real, production use exists, and mentions in annual reports have risen sharply. Maturity hasn't caught up, which is why sequencing matters more than ambition in 2026.
The End-to-End Underwriting Automation Workflow
Underwriting automation works when each stage has clear entry criteria, exit criteria, and a referral path, so that a submission failing a check leaves the automated path for review instead of moving on.
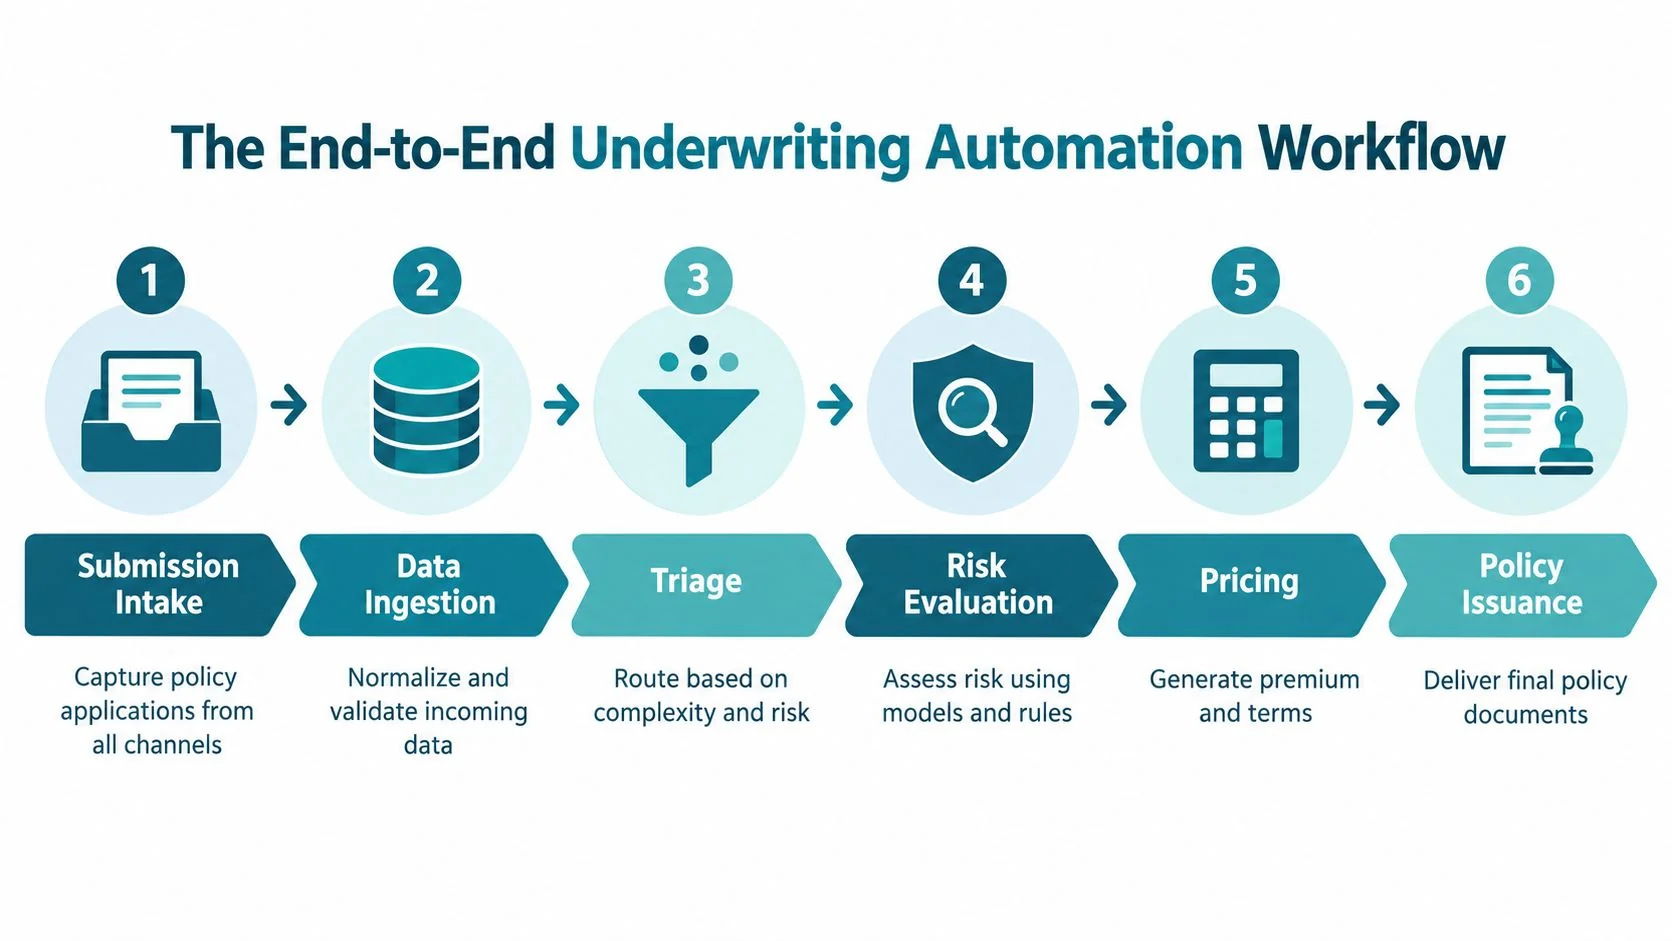
The six stages below show where automation changes handling and where it only prepares a decision.
Six Stages, Different Controls
- Submission intake: Capture applications from brokers, agents, portals, and email, then assign a persistent submission identifier so nothing is tracked only in an inbox.
- Data ingestion: Extract, normalize, and validate fields, flag missing or contradictory items, and preserve the original document alongside structured values.
- Triage: Route by appetite, completeness, complexity, and confidence, so simple risks don't wait behind specialist cases.
- Risk evaluation: Apply rules and models to eligibility, hazards, exposures, and history, and record which evidence drove the view.
- Pricing support: Generate premium indications, terms, limits, and referral reasons within delegated authority rather than inventing a final price in isolation.
- Decision and issuance: Approve, decline, refer, or request information, then issue documents with a complete decision trail.
Each handoff needs a different control. Intake needs completeness checks, ingestion needs field-level validation, evaluation needs confidence thresholds, and issuance needs authority checks. If you automate a later stage before fixing an earlier one, you'll process bad inputs faster.
The walkthrough below shows the sequence in operational form.
<iframe width="100%" style="aspect-ratio: 16 / 9;" src="https://www.youtube.com/embed/ktVjWs_ppas" frameborder="0" allow="autoplay; encrypted-media" allowfullscreen></iframe>Map your current process to these stages before buying technology. Teams often discover their constraint is not decision logic but that submissions arrive incomplete, external data is stitched in manually, and referrals don't carry a structured reason, so underwriters redo work the system claimed to automate.
Rules Engines, Machine Learning, and Generative AI Compared
Mature stacks don't choose one layer. They assign each layer to the work it can defend. Rules engines enforce appetite, regulation, and authority. Classical machine learning scores risk from structured history. Generative AI reads and summarizes unstructured evidence, then hands structured outputs to the other layers.
A benchmark of 59,381 health insurance applicants illustrates both the strength and the limit of classical models, with XGBoost reaching 83.1% binary accuracy and a Matthews correlation coefficient of 0.624, while performance declined as risk classes increased in the health underwriting benchmark comparing Random Forest, XGBoost, and LightGBM. The benchmark suggests broad eligibility segmentation is easier than granular multi-class recovery. Teams shouldn't present one accuracy figure as permission to automate every distinction the model was asked to make.
Where Each Layer Fits
Technology Layers in Underwriting Automation
| Layer | Best-Fit Underwriting Task | Key Strength | Main Limitation |
|---|---|---|---|
| Rules engine | Eligibility, appetite, authority, mandatory referrals | Transparent and testable | Brittle when exceptions multiply |
| Classical ML | Risk scoring, triage priority, fraud flags | Calibrated probability from history | Degrades on granular, imbalanced classes |
| Generative AI | Document extraction, submission summaries, evidence synthesis | Handles unstructured text at scale | Needs grounding, review, and output validation |
For broader context on that third layer, see how insurers are applying generative AI across the value chain. In underwriting, its safest role is preparatory. It can extract exposures from inspection reports, summarize broker notes, and list missing evidence, but a rules or model layer should validate values before they affect price or eligibility.
Use calibrated probabilities, confidence thresholds, and referral rules for borderline cases. Monitor class-level recall, calibration, and subgroup outcomes alongside aggregate accuracy, because a strong headline score can conceal weak performance on minority classes. If a model can't maintain performance at the granularity your pricing needs, reduce the decision it's allowed to make, don't lower the threshold and hope volume compensates.
Decision Automation Patterns by Line of Business
More than the line of business, what matters in 2026 is whether the data behind each submission is complete, current, and reconstructable enough to defend a decision, because a polished score can still sit on thin intake.
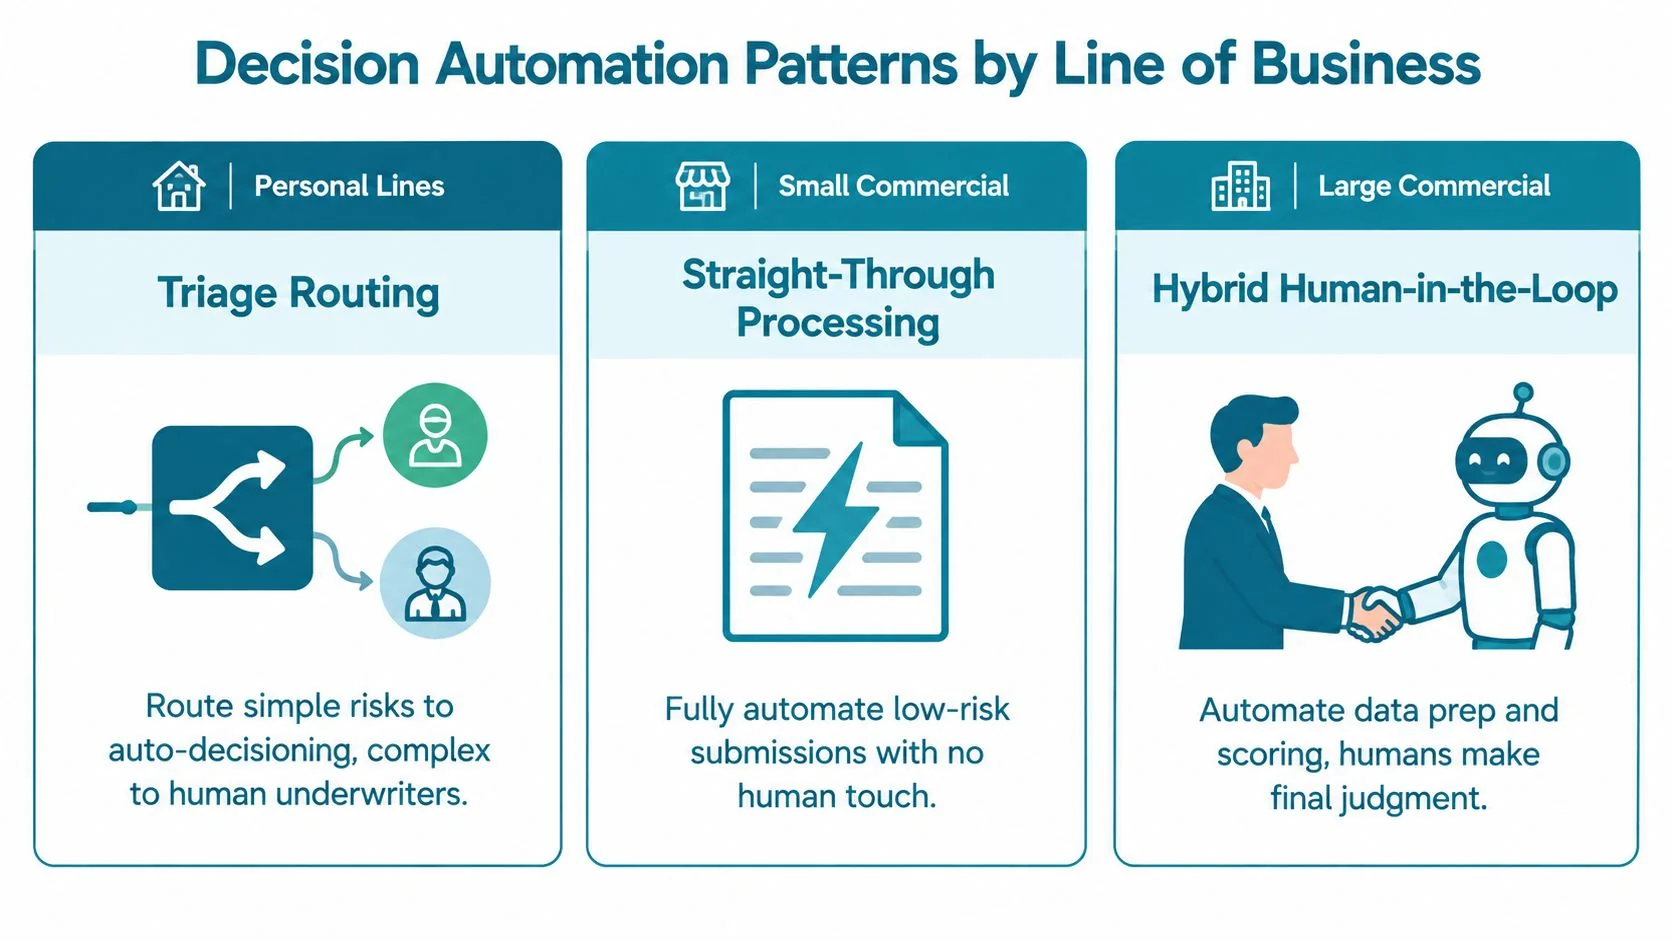
Personal lines earns the most autonomy. Standardized applications, stable eligibility questions, and third-party fields let clean submissions move to auto-decision, incomplete files trigger targeted requests, and conflicts reach an underwriter already highlighted. The operating pattern is triage routing: machine speed for the clear majority, human attention for ambiguity.
Small commercial sits nearer the boundary. Straight-through processing is justified only for narrow segments where appetite, data completeness, exposure limits, and pricing authority are explicit and auditable; outside that box, the file should degrade to referral rather than improvise. Specialty and large commercial remain augmented by design, since accumulation, wording, broker nuance, and negotiation trade-offs still require accountable judgment after documents are extracted, hazards enriched, and summaries drafted.
A line earns more authority after outcomes, overrides, and loss performance prove the narrower segment is stable. Fast document handling in a pilot is weak evidence for wider auto-bind.
That promotion path depends on disciplined insurance risk assessment that separates eligibility, hazard, and pricing signals. Expand segment by segment, keep referrals strong where inputs are sparse, and preserve the trail regulators may test: source data, rule outcome, model confidence, override reason.
Integration Patterns and the Data Bottleneck
A pilot can succeed on clean, hand-prepared files and still stall in production. At that point the constraint shifts from model capability to data movement: whether broker submissions, policy administration records, inspection documents, medical evidence where relevant, and third-party feeds can travel through governed interfaces without manual reconciliation. EY's spring 2025 survey identified data privacy, data quality and security, and inability to integrate legacy IT as leading barriers, and a separate 2025 leader survey found 52% cited skills or resource constraints, 40% data challenges, and 36% regulatory challenges, with data and document processing at 64% and process automation at 60% as the most common applications in EY's spring 2025 generative AI in insurance survey.
Insurers are automating information handling first. The ordering is correct, because feeding a model is a prerequisite to trusting it.
Match the Pattern to the Constraint
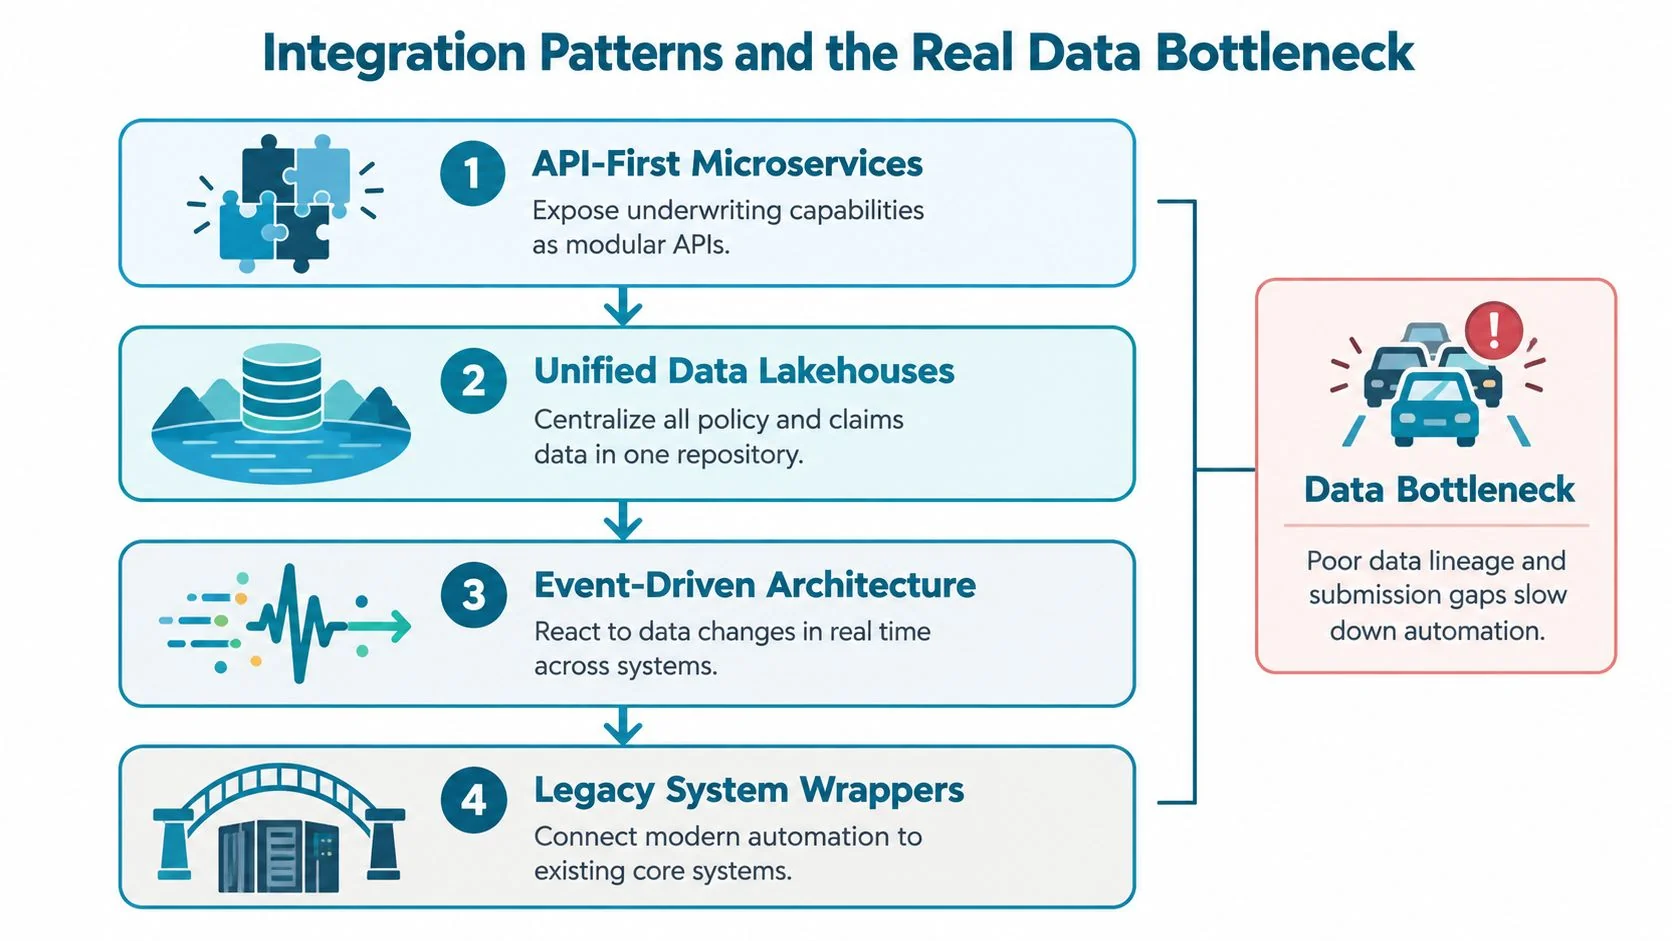
Four patterns dominate integration choices. Each solves a different constraint, so the selection question is which constraint is binding on your book.
| Pattern | Constraint it addresses |
|---|---|
| API-first microservices | Modular intake, enrichment, rating, and referral services that multiple channels can call consistently |
| Unified data lakehouse | Lineage and analysis, where underwriting, claims, and exposure data must share governed definitions |
| End-to-end risk platform | Workflow fragmentation, provided it does not force premature replacement of core systems |
| Legacy adapter layer | Policy administration that cannot change quickly, with wrappers translating events while containing technical debt |
These choices sit inside the broader question of insurance software systems and how core platforms exchange data. Whatever pattern you select, assign ownership for data errors, exception queues, and fallback procedures before launch. If an external feed fails mid-quote, staff need a predetermined answer: pause the file, proceed with disclosed limitations, or route to manual review. Every option must also preserve lineage, since that is what examiners will eventually ask to see.
Fund submission completeness and lineage as underwriting controls, not IT housekeeping. They determine whether automation can be trusted.
Run a readiness assessment that scores source quality, identifier consistency, document variability, consent and privacy handling, and integration latency. Then prioritize the fixes that unblock the highest-volume exception reasons. That work is less glamorous than a new model, and it is usually where ROI appears first, through less rework rather than fewer people.
Governance, Fairness, and Contestability in Production
A reviewer who signs off on a model decision in seconds has added a step, not a safeguard. Human-in-the-loop review fails when the reviewer sees a score without actionable reasons, lacks authority to override, or is measured only on throughput. The workable standard is auditable human authority: explanations a reviewer can act on, logs that survive examination, and overrides that get measured instead of merely permitted.
That distinction is now being tested by regulators, and the early numbers are unflattering. A 2025 NAIC survey of 93 insurers found more than 90% had AI governance principles aligned with NAIC principles, yet compliance weakened on letting health insurance applicants contest adverse decisions and on keeping logs of those contested cases in NAIC Big Data and AI Working Group materials from July 2025. Adoption of principles is nearly universal. The evidence machinery behind them is not.
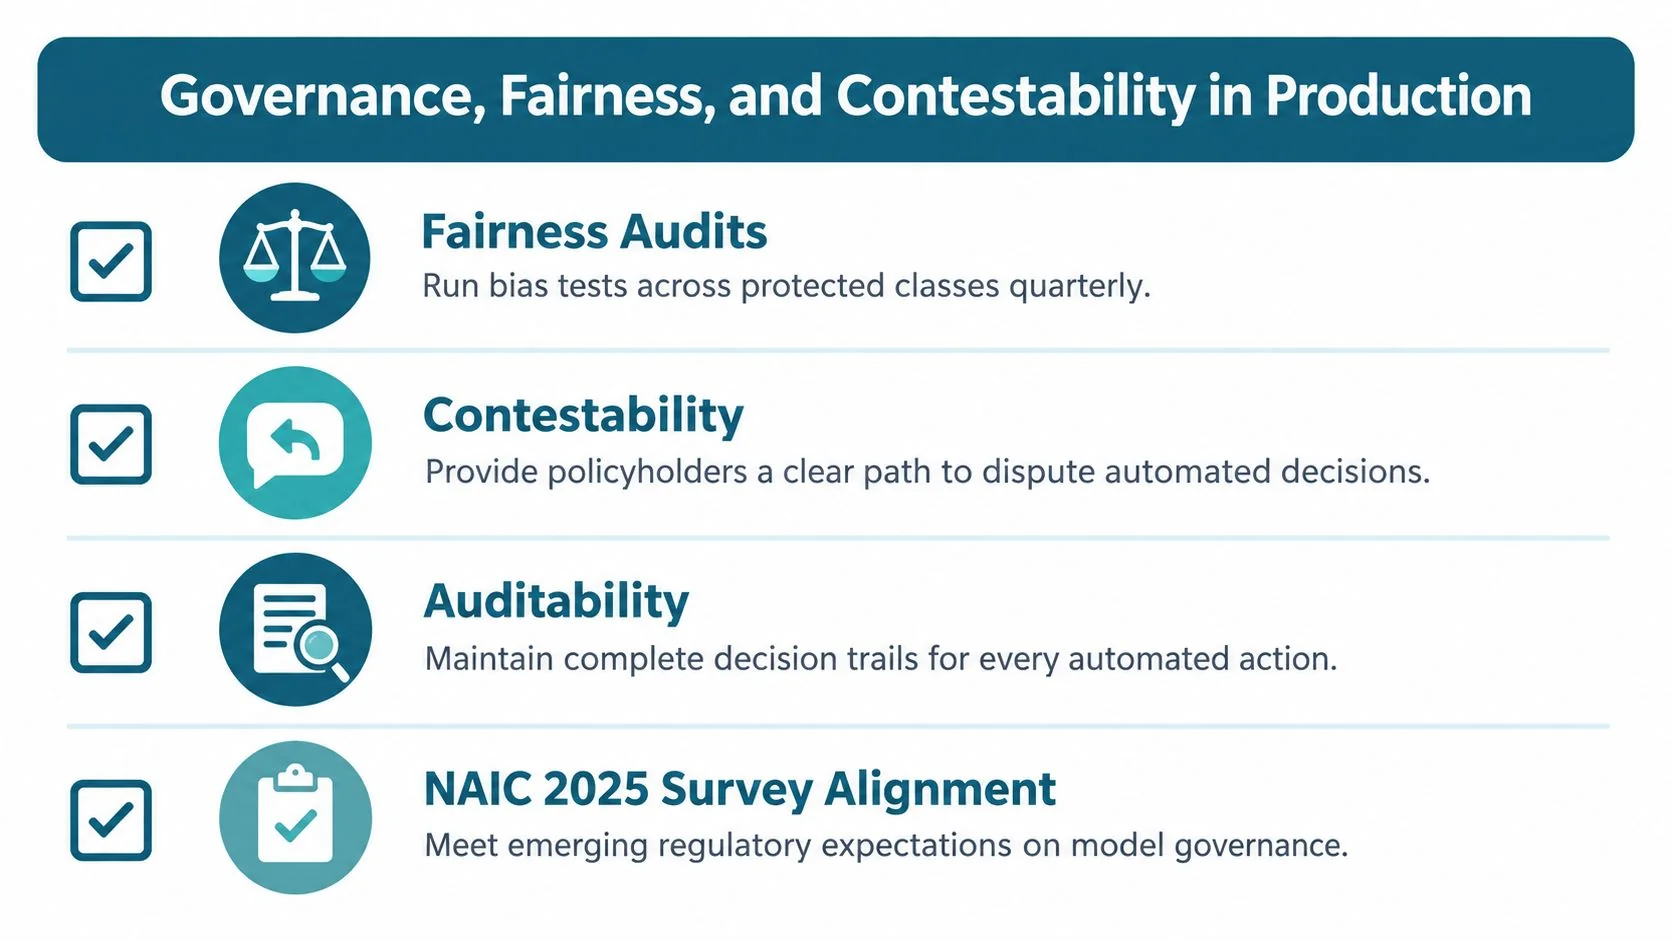
The practical test for any live decision reduces to four questions, and each maps to a build requirement. Reconstruct: could you replay the inputs, model and rule versions, scores, reviewer actions, and final terms for one specific policy months later? Explain: can the applicant and the reviewer both see the principal factors, the source data behind them, and the correction path, expressed as feature contributions rather than generic risk language? Correct: is there a defined contestability workflow covering who receives appeals, what evidence counts, response timelines, and how outcomes feed back into data and model fixes? Prove: do approval, referral, pricing, override, and appeal outcomes hold up across segments, with proxies that reproduce protected characteristics investigated rather than assumed away?
A fifth requirement sits behind the first four. Override authority has to be real: measure override rate and direction, log reviewer disagreements, and protect reviewers who overturn the system for documented reasons. An override nobody dares use leaves you with the same procedural sign-off problem.
EU materials point the same direction, identifying explainability, discrimination, cybersecurity, and supply-chain concentration as significant insurance AI risks, with certain life and health risk assessment and pricing treated as high risk. Legal, compliance, model risk, and underwriting should agree on evidence standards before deployment, not after the first examination. A model that cannot pass the reconstruct-explain-correct-prove test is accurate in testing at best.
KPIs That Connect Underwriting Automation to Profitability
Throughput alone can mislead. A team can raise straight-through processing by widening appetite, lowering thresholds, or pushing work into downstream endorsements and claims. Profitability KPIs force automation to prove it selected and priced risk well, not just moved submissions quickly.
The executive gains noted earlier should be treated as targets to earn, because they came from expectations rather than independently verified portfolio results. Build a KPI stack that connects operational movement to underwriting outcome and gives each metric an accountable owner.
A KPI Stack With Owners
Underwriting Automation KPIs and Measurement Cadence
| KPI | Owner | Measurement Source | Review Cadence |
|---|---|---|---|
| Straight-through processing rate | Underwriting operations | Workflow and policy administration logs | Weekly |
| Decision cycle time | Underwriting operations | Submission timestamps by segment | Weekly |
| Quote-to-bind conversion | Line underwriting lead | Quote, bind, and broker channel data | Monthly |
| Loss ratio movement | Chief underwriter and actuarial | Earned premium and claims by cohort | Monthly and quarterly |
| Override and referral quality | Model risk and line lead | Review queue and override logs | Weekly |
| Model drift and calibration | Data science lead | Production scoring and outcome data | Monthly |
| Segment fairness outcomes | Compliance and model risk | Decision, pricing, and appeal logs | Monthly and quarterly |
Instrument cohorts from day one. Compare automated, augmented, and manual cases with similar risk characteristics, and track submission completeness, rework, exception reason, premium adequacy, and early claims signals alongside speed. Without cohort discipline, mix shift will masquerade as automation benefit.
Measurement rule: Never report cycle time without a quality counterweight such as override quality, referral precision, loss performance, or segment outcomes.
Review leading indicators weekly and lagging profitability indicators as cohorts mature. If cycle time falls while overrides rise and bind quality deteriorates, the program isn't creating value but transferring effort and risk to later stages, where correction costs more.
Building a 90-Day Underwriting Automation Roadmap
Start with a narrow segment where volume is meaningful, inputs are repeatable, and underwriters can articulate current decision rules. Don't start where the book is most complex just because the potential saving looks largest. Complexity multiplies data, explanation, and integration requirements before you've built the control foundation.
The planning sequence below keeps the first quarter focused on evidence rather than scale.

Weeks 1 to 4 and Weeks 5 to 8
- Weeks 1 to 4 readiness: Map lineage, score submission completeness, catalog exception reasons, confirm integration points, and baseline cycle time, rework, conversion, and referral outcomes.
- Weeks 5 to 8 pilot: Automate one bounded workflow, set confidence and authority thresholds, document fallback to manual handling, and train reviewers on explanations and override rights.
Keep the pilot decision reversible. Run shadow or assisted mode first if explanations, calibration, or segment outcomes aren't ready for binding authority.
Weeks 9 to 12
- Governance instrumentation: Activate decision logs, contestability handling, drift checks, fairness monitoring, and weekly override review.
- ROI calculation: Value reduced rework, faster bind on wanted risks, improved completeness, and avoided leakage, instead of assuming headcount removal.
- Scale decision: Expand only to adjacent segments that share inputs and controls, and keep a written stop rule if quality counterweights deteriorate.
Benchmark your pilot against comparable implementations before committing to scale. AI for Insurance maintains a searchable database of verified insurance AI case studies that teams can filter by line, use case, and technology, which is one option for checking whether your expected throughput and outcome measures resemble documented peer deployments. Underwriters should own decision boundaries, data leaders should own lineage and calibration, and CIOs should own integration resilience. Shared ownership without those distinctions usually produces shared ambiguity.
Start this week by picking one underwriting segment, baselining its completeness, cycle time, rework, and override data, and writing the stop rules for a 90-day pilot before you discuss new models. Then compare your baseline and target outcomes against verified peer cases, assign owners for data, decisions, and integration, and fund the readiness fixes that your exception queue says matter most.
