Insurance Fraud Detection: A 2026 Guide for Insurers
Discover proven tools and strategies for insurance fraud detection in 2026. This guide helps modern insurers protect their bottom line.
Written by AI for Insurance
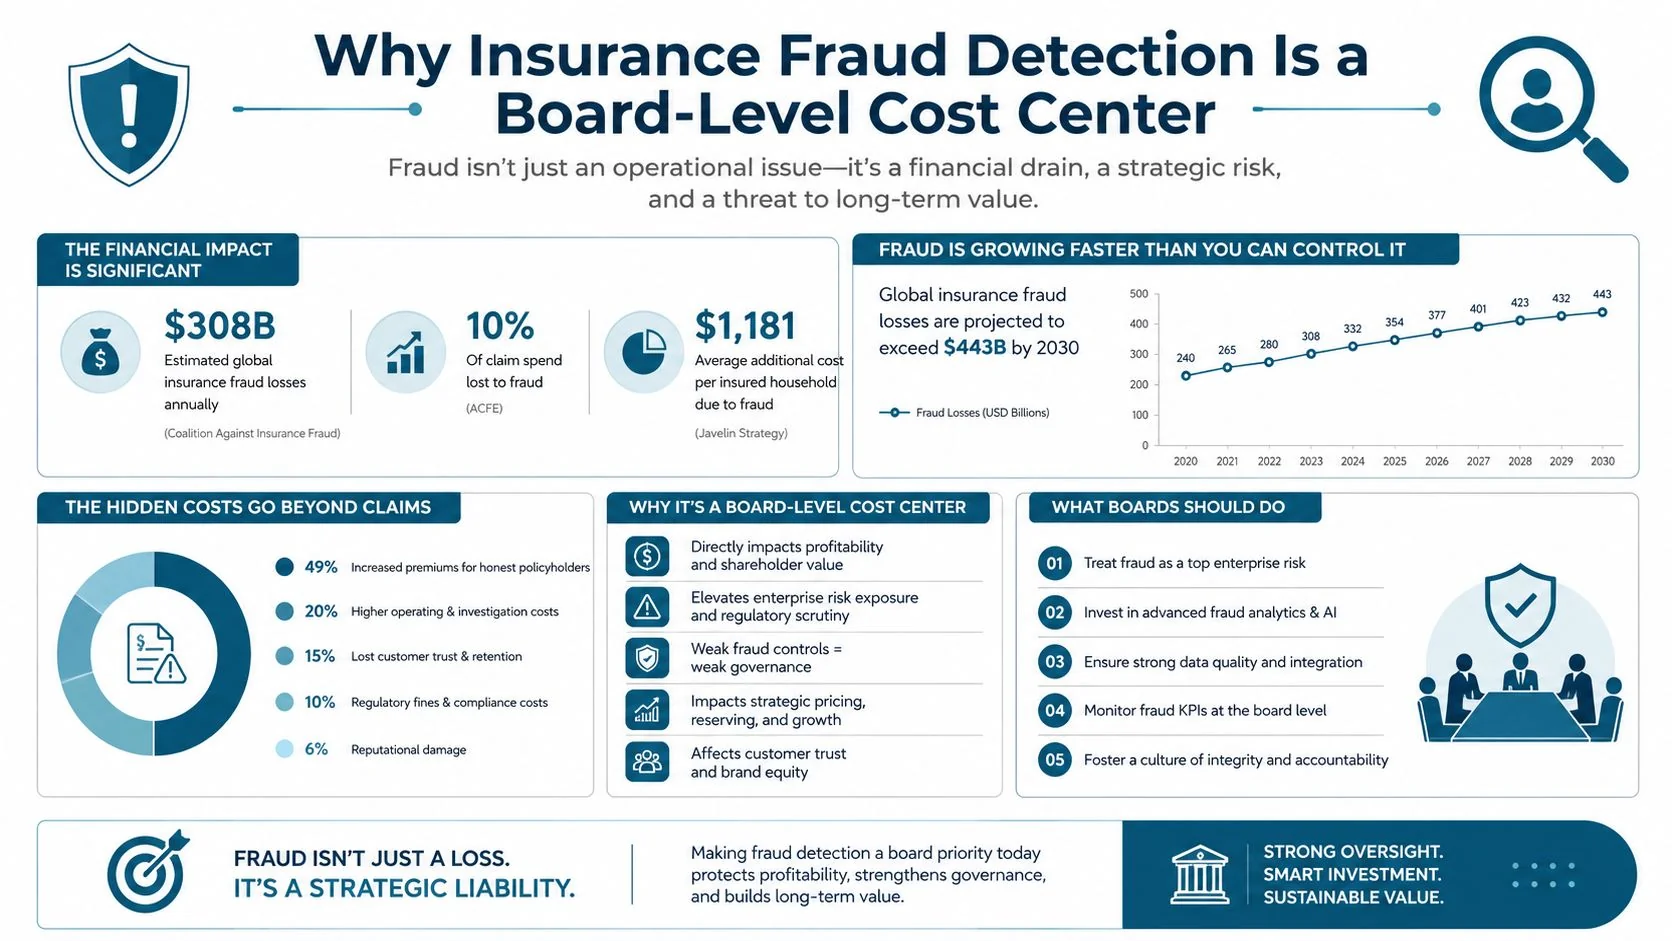
Insurance fraud drained at least $80 billion globally each year across all insurance lines by the Coalition Against Insurance Fraud's long-running estimate, while property-casualty fraud is commonly associated with about 10% of losses (Coalition Against Insurance Fraud statistics). That makes insurance fraud detection more than a claims-control project. It's a direct defense of underwriting margins, reserve quality, investigator capacity, and customer trust.
The most important shift for 2026 is timing. Claims-stage analytics still matters, but application fraud, synthetic identity, manipulated documents, and coordinated entity networks are moving the control point closer to quote and policy issuance. Insurers that only ask whether a filed claim looks suspicious are inspecting the damage after the risk has already entered the book.
Table of Contents
- Why Insurance Fraud Detection Is a Board-Level Cost Center
- The Detection Pipeline From Rules to Graph Neural Networks
- Metrics That Matter in Fraud Detection
- Graph and Relational Models for Organized Fraud Rings
- The Fraud Arms Race Generative AI Is Accelerating
- Application and Identity Fraud: The New Detection Frontier
- Evaluating Fraud AI Vendors and Operating Models
Why Insurance Fraud Detection Is a Board-Level Cost Center
The Association of British Insurers reported £1.16 billion in fraudulent general insurance claims detected in the United Kingdom in 2024, compared with £1.14 billion in 2023. Insurers also uncovered more than 98,400 fraud-related claims in 2024, up from 88,100 the year before, and prevented an estimated 684,800 fraudulent applications (ABI fraud detection report). Those figures place fraud control at two points in the value chain: claims and submission. The application count makes identity, document, and applicant verification a board concern before a policy enters the book.
A detected case produces a visible saving. An undetected case can generate claim payment, adjustment and investigation expense, distorted loss data for pricing, and higher premiums for honest customers. Historical UK government reporting cited detected insurance fraud of £1.3 billion in 2013 and £1.32 billion in 2014, alongside estimated undetected annual fraud of about £2.1 billion (Coalition Against Insurance Fraud statistics). Detection totals therefore describe only the fraud an insurer can identify and prove, not the full exposure.
Fraud belongs in the P&L conversation
Boards should treat fraud as measurable leakage rather than a compliance checkbox. The relevant questions extend beyond how many alerts reach the SIU. How much confirmed fraud does the organization capture? How much investigator capacity does the program consume? How often do legitimate customers face friction? Do application controls stop questionable risk before it becomes future claims exposure?
The $308.6 billion annual U.S. insurance fraud loss benchmark cited by the Coalition Against Insurance Fraud shows the scale of the issue, although insurers should plan and evaluate models against their own portfolios. Michigan's Department of Insurance and Financial Services also cites the widely used estimate that fraud represents about 10% of property-casualty losses and loss-adjustment expenses (Coalition Against Insurance Fraud statistics).
The board-level cost is therefore a portfolio problem, not only an SIU workload problem. A model can increase referrals while worsening economics if investigators spend time on false positives, underwriting receives late signals, or applicants abandon legitimate purchases during verification.
Board question: What is our confirmed fraud capture rate, and how much legitimate customer friction do we create to achieve it?
Why detection timing changes economics
A claim that reaches settlement has already consumed review, documentation, payment controls, and potentially recovery work. A suspicious application can often be stopped, verified, referred, or declined before those costs accumulate. An identity mismatch is not proof of fraud. It is a signal for proportionate verification and a decision about whether the risk belongs on the book.
This timing also changes measurement. Claims-stage performance can look strong while application fraud continues to introduce adverse selection and synthetic identities. A useful board view connects early interventions with later claim outcomes, while keeping the evidence categories separate.
The strongest reporting distinguishes prevented applications, referred claims, confirmed fraud, and recoveries. One “fraud prevented” number conceals the difference between a hard stop, an investigative referral, and a payment that was never at risk. Mature programs also report false-positive workload. An alert that consumes scarce SIU capacity without improving confirmed capture is an operating loss presented as model activity.
The Detection Pipeline From Rules to Graph Neural Networks
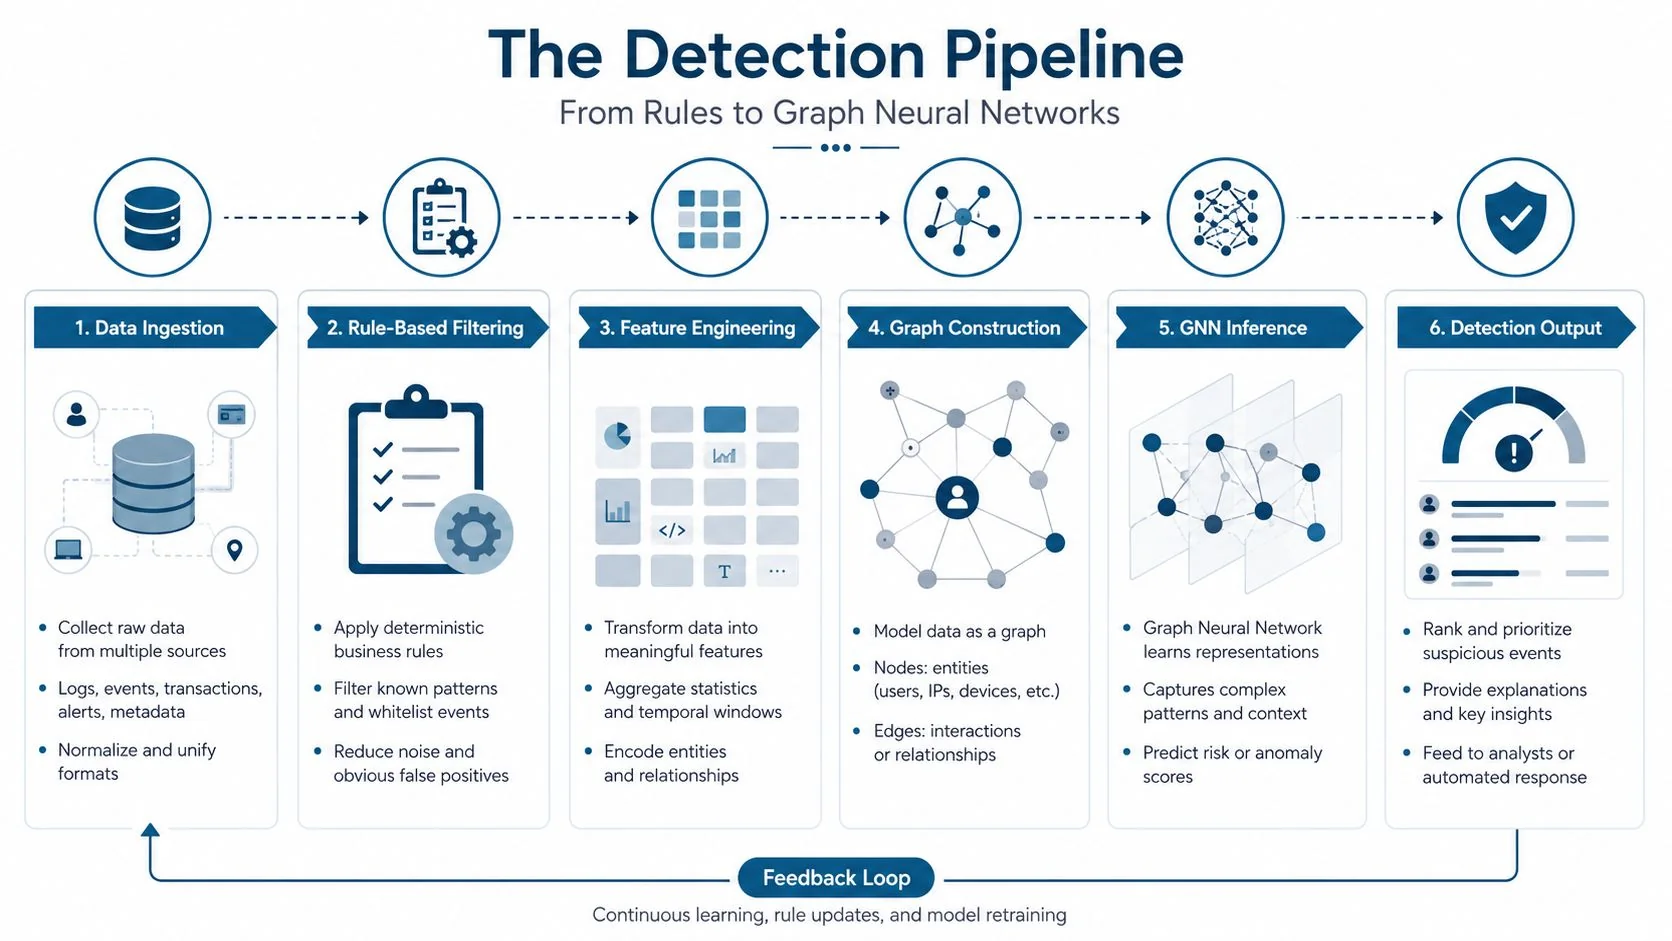
A fraud pipeline should make each decision layer answer a different question. Deterministic controls catch explicit violations, statistical models rank records that resemble prior fraud, anomaly methods surface unfamiliar behavior, and graph analysis exposes relationships hidden in individual records. Treating any one layer as the decision maker creates predictable blind spots.
Start with deterministic controls
Rules engines and watchlist matching provide the first screen. They test policy dates, coverage status, duplicate identifiers, known entities, inconsistent loss descriptions, and hard business constraints. Rules are fast, auditable, and easy for claims leaders to challenge or amend. Their weakness is transparency to the fraudster. Once a rule is understood, the input can change while the underlying scheme remains intact.
The next layer uses supervised machine learning, trained on adjudicated outcomes such as confirmed fraud, cleared referrals, and legitimate settlements. Tree-based classifiers can combine claim attributes, customer history, timing, channel, policy details, and operational signals. The model ranks work rather than replacing adjuster judgment, directing experienced staff toward cases with higher expected value.
Detect what the labels don't contain
Historical labels reflect yesterday's investigations and the cases an insurer was equipped to recognize. Anomaly detection adds coverage for patterns without confirmed fraud labels. Isolation methods can identify unusual combinations, while autoencoder-style approaches can flag records that reconstruct poorly against learned behavior.
An unusual record is not automatically a fraudulent one. A rare legitimate loss can trigger the same signal, so anomaly outputs normally belong in proportionate review or verification rather than automatic adverse decisions. This layer is particularly useful for application and identity signals, where new synthetic identities may not yet appear in claims labels.
Connect entities, then hand off cases
The fourth layer uses link analysis and graph neural networks to connect policyholders, claims, vehicles, providers, repair facilities, addresses, payment accounts, and procedures. A claim may look ordinary alone. Shared entities across many records can reveal coordinated activity, including relationships that claims-stage rules never observe.
The orchestration layer should retain each model's reason codes, score calibration, input timestamp, and decision path. SIU investigators need linked evidence and a reviewable rationale, not an unexplained risk number. Their decisions, supporting evidence, and disposition reasons then support monitoring, threshold changes, and retraining.
A workable flow is:
- Ingest: Normalize claim, policy, application, identity, payment, and interaction data.
- Screen: Apply deterministic rules and known-entity controls.
- Score: Run supervised and anomaly models with versioned features.
- Relate: Add network features and linked-entity context.
- Prioritize: Rank alerts against SIU capacity and expected case value.
- Investigate: Record outcomes, evidence, and disposition reasons.
The pipeline's value comes from separation of duties across layers. Rules test known conditions. Machine learning estimates similarity to past fraud. Graph models assess whether a record belongs to a suspicious network. Operational teams can then tune each stage without hiding model uncertainty inside a single score.
Metrics That Matter in Fraud Detection
Accuracy is usually the wrong headline metric. Fraudulent claims are typically less than 1% of total claims, so a model can report high accuracy by classifying nearly every record as legitimate while missing the rare events the insurer needs to find (industry analysis of fraud-model metrics).
The first operating decision is the alert budget. An SIU can investigate only the volume its people, processes, and legal obligations can support. A model that identifies more suspicious records but overwhelms the queue has not improved the program. Evaluation should therefore focus on the top of the ranked list, under realistic staffing, referral, and documentation conditions.
Precision and recall are operating choices
Precision measures how many referred cases are confirmed as fraudulent. Recall measures how much of the known fraud population the model captures. Raising the decision threshold often improves precision while reducing recall. Lowering it can surface more potential fraud, but it also increases false positives and customer or investigator friction.
Teams should track F1, which balances precision and recall, and capture rate, which measures fraud caught against the total estimated fraud opportunity. The cited car-claims analysis found that Random Forest with undersampling achieved an F1-score of 0.80. Its SHAP analysis also surfaced operationally meaningful predictors, including fault assignment, policy type, and month claimed (comparative machine-learning analysis). That result illustrates how to evaluate a model and explain its output. It is not a universal production target.
| Metric | What It Measures | Typical Production Target | Common Pitfall |
|---|---|---|---|
| Precision | Share of alerts confirmed as fraud | Set against SIU capacity | Optimizing precision can hide missed fraud |
| Recall | Share of known fraud captured | Prioritize by line and fraud value | Labels may omit undetected fraud |
| F1 | Balance between precision and recall | Compare models on the same holdout | A single score can hide queue economics |
| Capture rate | Fraud caught relative to estimated fraud | Track longitudinally | Total fraud is partly unobservable |
| Alert-to-confirmation ratio | Conversion from referral to confirmed case | Monitor by segment and threshold | Confirmation rules may vary across teams |
| Investigator hours per confirmed case | Operational cost of model output | Reduce wasted review effort | Low hours can reflect shallow investigations |
Measure workload, not only model lift
Every alert consumes investigator time. Teams gather documents, contact involved parties, record decisions, and may support litigation or regulatory review. The useful production measure is therefore confirmed fraud value per investigator hour, not an offline score alone.
Application and identity fraud require the same discipline. A model can rank suspicious applications or identity relationships effectively, yet create little value if investigators cannot verify the evidence or if legitimate applicants receive unnecessary friction. Track conversion, review time, referral outcomes, and confirmed value by channel and product, then compare those results with claims-stage queues.
Use time-based validation where possible. Random splits can leak patterns across training and testing when the same entities, providers, or recurring behaviors appear in both periods. Monitor drift by channel, product, geography, and customer segment. Aggregate performance may remain stable while the model becomes less useful for the specific queues an SIU handles.
Practical rule: Calibrate the ranked queue first. Optimize the algorithm second.
Graph and Relational Models for Organized Fraud Rings
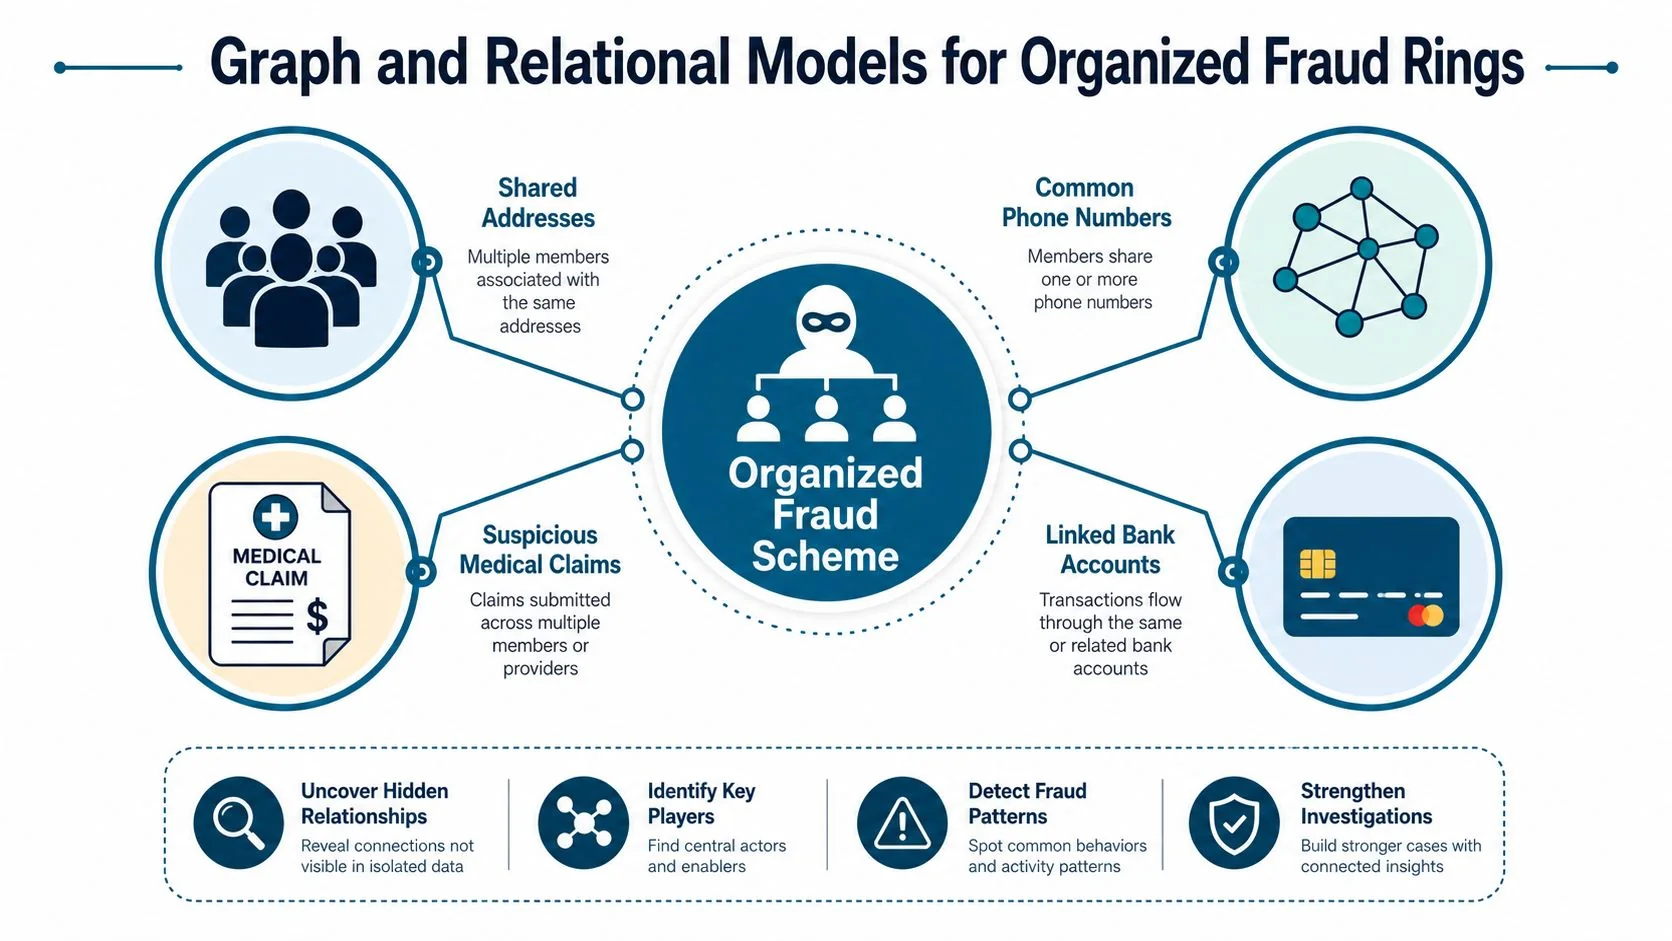
A claim-level model asks whether one record looks suspicious. Organized fraud requires a wider question: which records, people, providers, vehicles, and accounts are connected? One provider may appear legitimate in an isolated claim. Several providers linked through unusual patient, address, procedure, or payment relationships can indicate coordinated activity.
Why heterogeneous graphs matter
A graph represents entities as nodes and relationships as edges. Insurance nodes may include claims, policyholders, vehicles, providers, procedures, repair shops, attorneys, addresses, devices, and bank accounts. Edges describe relationships such as “submitted,” “treated by,” “repaired at,” “shares address with,” or “paid to.”
A heterogeneous graph retains the type of each entity and relationship. That distinction affects interpretation. A shared provider relationship means something different from a shared address, and both differ from a repeated payment account. Homogeneous graphs flatten these differences and can discard useful context.
A medical-claims study used 6 million data points and reported HINormer F-scores of 84% on a small dataset and 82% on a large dataset. RE-GraphSAGE reached 81% on the medium dataset (Scientific Reports study of heterogeneous graph models). The findings show that architecture choice matters when data contains multiple entity types and relationships. They do not support transferring a model directly into another insurer's portfolio.
A graph model still needs clean foundations
Graph neural networks use neighborhood aggregation and message passing to combine information from connected nodes. A claim can inherit context from linked entities, while the system can identify clusters that a flat feature table captures only indirectly.
That advantage depends on entity resolution. If one repair facility appears under several identifiers, the graph fragments. If unrelated people are mistakenly merged, it creates false suspicion. New entities also present a cold-start problem because they have little history. Label leakage can inflate offline results when investigation outcomes or post-settlement information enter training features.
Investigators need an explanation they can verify. A useful alert might show a shared payment account, recurring provider connections, overlapping addresses, and the relevant sequence of events. “The graph score is high” is not an investigation plan.
For insurers with multi-claim, shared-provider, or multi-policy data, graph analytics should sit above rules and tabular models, rather than replace them. A documented implementation is described in this U.S. P&C insurer achieves 135% increase in fraud detection efficiency with graph analytics. The operational test is straightforward: can investigators understand the relationship, verify it, and act on it?
The Fraud Arms Race Generative AI Is Accelerating
Generative AI has shortened the path from intent to convincing fraud. It can produce persuasive narratives, altered documents, synthetic identities, fabricated imagery, and manipulated audio or video, while many insurers still organize controls around conventional claims review. A stronger model alone does not create a durable advantage if the operating process cannot authenticate evidence or connect activity across the customer journey.
Recent industry reporting describes fraud as increasingly organized and digital. Generative systems support fake imagery, forged documents, and deepfake audio or video, while fraud capabilities remain divided across teams. Insurers must balance tighter controls with customer friction, as discussed in this ABI analysis of emerging insurance fraud trends.
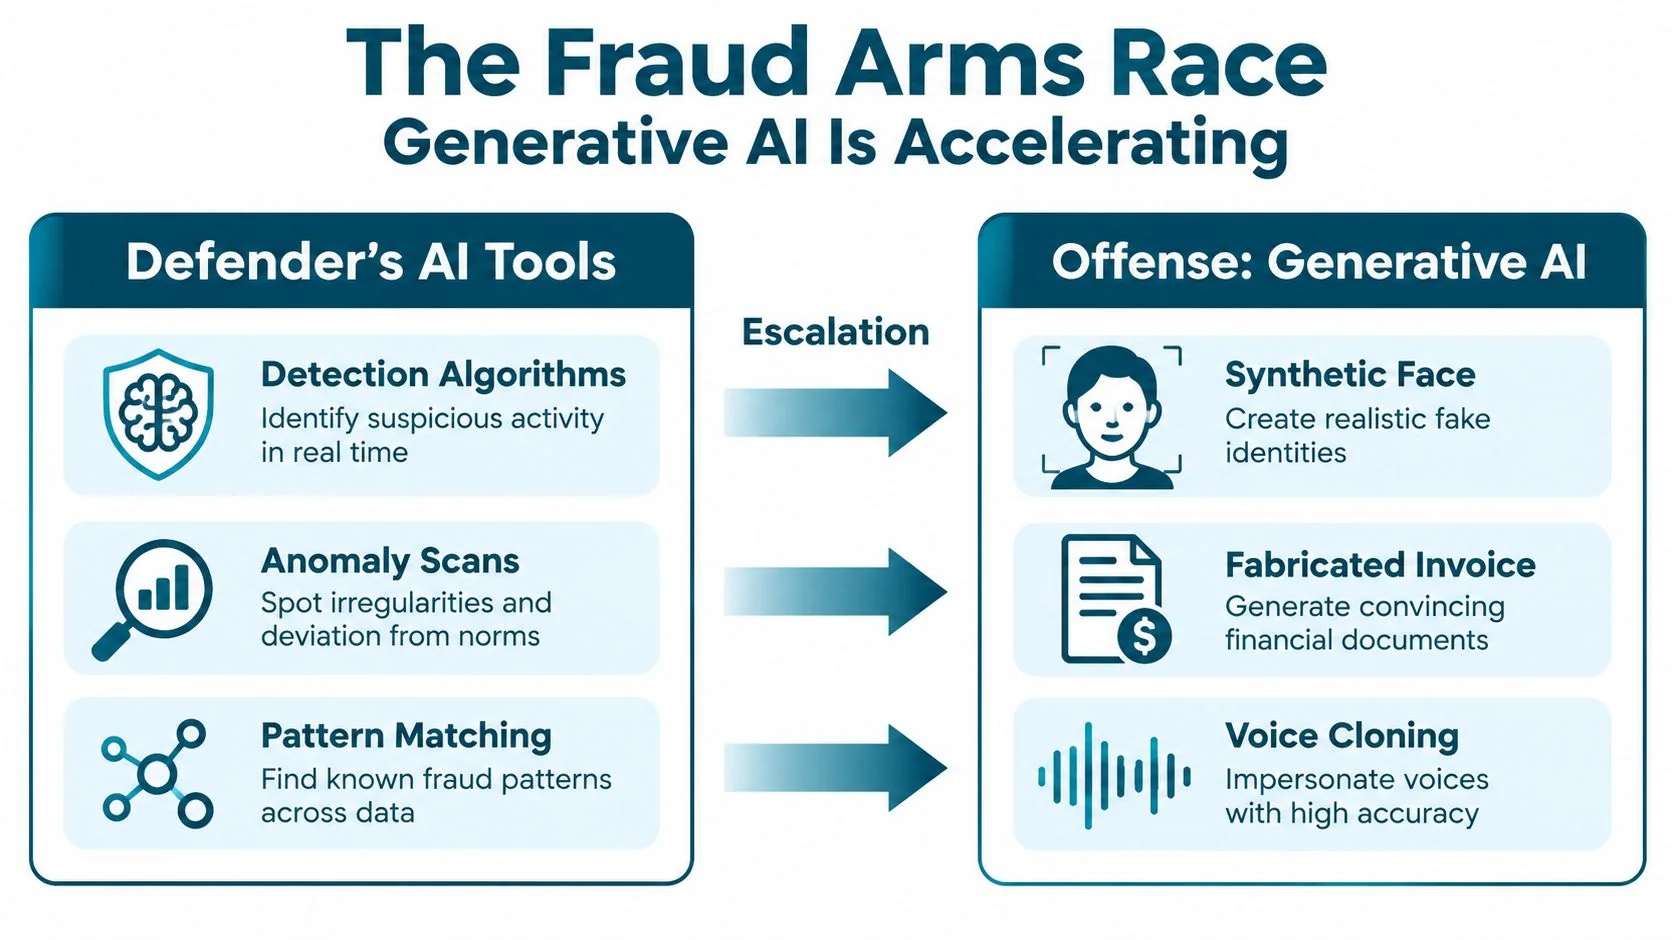
Synthetic evidence changes the review problem
A document can be internally consistent and still be fabricated. A claimant's account can sound natural while being generated or coached. Review processes that search mainly for contradictions will miss evidence designed to remain coherent across channels.
The control objective is therefore verifying provenance and behavior across the journey. Relevant signals include document lineage, metadata consistency, liveness, device behavior, session timing, identity relationships, and alignment with independent records. No single signal should determine an adverse decision. Genuine customers can also submit unusual files or use shared devices.
Deepfake detection remains an immature control area, according to the cited industry survey, which reported that only 32% of insurers felt very confident detecting deepfakes in its 2026 study. The gap is operational as much as technical. Carriers need clear ownership, escalation paths, and evidence standards before adding another model.
Put controls before the claim
A claims-stage document review program is late if the same identity and document risks were visible during application. Early checks should establish a consistent identity record, preserve evidence provenance, and let underwriting or fraud teams intervene proportionately. The application layer thus becomes a control point rather than merely a source of additional data.
Defenders can combine automated media analysis with behavioral biometrics, liveness checks, device intelligence, and human review. The objective is to make synthetic behavior harder to scale while keeping legitimate applicants moving. Controls should also feed investigation workflows, because a score without usable evidence creates review volume rather than resolved cases.
A document-processing and fraud detection case study illustrates why document workflows require operational integration, not only a model endpoint.
A short visual example of AI-enabled intake and fraud assessment connecting customer interaction with human review appears below.
<iframe width="100%" style="aspect-ratio: 16 / 9;" src="https://www.youtube.com/embed/-7qk_ucKsqc" frameborder="0" allow="autoplay; encrypted-media" allowfullscreen></iframe>
Application and Identity Fraud: The New Detection Frontier
Application-stage detection is the earliest practical fraud control point. It operates before a policy is bound, while claims-stage detection begins after an insured event is reported. That timing changes the economics: early intervention can limit questionable risk entering the book, whereas late detection often involves payment decisions, customer handling, and investigations already in progress.
Industry research identifies application and identity fraud as growing concerns, including synthetic identities and AI-enabled abuse, while insurers often manage underwriting, claims, and fraud capabilities in separate workflows (insurance fraud survey report). The operational question is whether the applicant, document, device, and stated history form a coherent identity before coverage starts. A plausible claim from a credible-looking policyholder is only one part of that problem.
| Dimension | Application-Stage Detection | Claims-Stage Detection |
|---|---|---|
| Intervention point | Before policy issuance or binding | After a loss is reported |
| Primary evidence | Identity, application, device, document, and stated history | Loss narrative, supporting records, prior claims, and linked entities |
| Business owner | Underwriting with fraud and identity support | Claims, SIU, and fraud operations |
| Tolerance for friction | Must preserve quote conversion and fair treatment | Can support deeper review because a claim already requires handling |
| Main benefit | Prevents questionable risk from entering the book | Stops or investigates suspicious payments |
| Main limitation | Early signals can be incomplete or ambiguous | Investigation cost and customer impact have already accumulated |
Build an early verification layer
Application controls work best when they combine signal families. No single identity match can reliably separate legitimate applicants from coordinated abuse.
- Device and session behavior: Flag unusual automation, rapid form completion, repeated device use, or location inconsistencies.
- Contact tenure: Treat newly created or weakly established email and phone identifiers as risk signals, not proof of fraud.
- Document authenticity: Test for alterations, inconsistent fields, uncertain provenance, and conflicts with the application.
- Behavioral signals: Examine repeated navigation, extensive copy and paste, and session characteristics that do not fit the stated applicant.
- Identity relationships: Connect applicants, where governance permits, to prior policies, claims, addresses, payment instruments, and devices.
The useful output is a proportionate next action, not a score displayed without context. A low-risk mismatch may justify an additional question or verification request. A cluster spanning identity, device, document, and relationship signals can support specialist review. Automatic rejection requires narrow rules, clear reason codes, documented controls, and review for fair treatment and regulatory compliance.
Keep claims controls in place
Early verification does not replace claims analytics. A legitimate policy can generate a fraudulent claim later, and organized actors can pass an initial screen with identities that appear credible. The architecture should carry identity and relationship context into first notice of loss, then combine it with loss-specific evidence through settlement.
Measure the control as a business process. Compare cost per intervention, fraud captured, quote or issuance friction, and downstream investigation avoided. Review results by product, channel, and applicant segment so aggregate performance does not conceal uneven customer impact.
Insurers should test these controls on their own historical application and claims data, with outcomes tied to actual review capacity. A signal that looks strong in isolation can still create an unmanageable queue, while a modest signal may matter when it prevents a policy from entering a connected fraud network.
Evaluating Fraud AI Vendors and Operating Models
A vendor evaluation should begin with a controlled test, not a feature checklist. Require each provider to run its approach on the insurer's historical data, freeze labels at a defined point, and compare results with the actual SIU queue. A polished demonstration shows what a system might do. It does not prove that the system can handle the insurer's data quality, fraud mix, application risks, identity signals, or operating constraints.
| Criterion | What to Ask For | Red Flag |
|---|---|---|
| Detection performance | Results on the insurer's historical holdout data | Demonstration data with no reproducible baseline |
| Queue economics | Precision, recall, capture, and workload at usable alert volumes | “Uplift” without threshold or denominator |
| Explainability | Reason codes, linked evidence, and investigator-readable narratives | A black-box score with no case context |
| Calibration | Probability outputs tested against observed outcomes | Scores presented as certainty |
| Data freshness | Retraining cadence, feature refresh, and service-level commitments | Vague claims about continuous learning |
| Deployment | API latency, batch options, security controls, and architecture fit | No answer on integration or exit effort |
| Governance | Versioning, audit trails, access controls, and review procedures | No documented model-change process |
Test the operating model, not just the model
Run a silent period first. Generate scores without changing decisions, compare alert rankings with investigator outcomes, and review false positives by product, channel, and applicant segment. Identify features that depend on unavailable, unstable, or weakly governed data. Then move into a controlled production workflow with explicit thresholds, escalation paths, and rollback criteria.
The SIU and fraud analytics team need a defined handoff. Analytics should own feature quality, monitoring, calibration, and model changes. The SIU should own investigative disposition and evidence standards. Claims and underwriting leaders should decide how referrals affect workflow, customer communication, and payment controls. Application and identity signals also need an owner, because a useful pre-issuance alert can become operational noise if no team is responsible for verification or escalation.
Track measures that expose operating reality:
- Alert-to-claim ratio: Whether referrals are concentrated in the intended risk population.
- Recovery rate: Whether confirmed cases produce recoverable value.
- Investigator hours per confirmed fraud: Whether the queue is economically workable.
- Disposition completeness: Whether analysts can learn from cleared and confirmed cases.
- Drift by segment: Whether performance changes across products, channels, or entity types.
AI for Insurance can serve as a searchable database of documented insurance AI implementations, including case-study metadata and measured outcomes where disclosed. For a model that continuously updates with new outcomes, review this continuously learning fraud detection case study as an example of the implementation evidence buyers should request. It is not a substitute for testing on the insurer's own portfolio.
Buyer standard: If a vendor cannot show where the score came from, how the threshold was chosen, and what happens when the data changes, the system is not ready for production.
Market growth indicates strong demand, not solved execution. Insurers should spend less time asking whether AI is available and more time proving whether their operating model can convert a score into a fair, explainable, investigator-ready decision. That proof should cover the full path from application and identity verification to claims referral, investigation, and final disposition.
Start with a portfolio diagnostic across applications, policies, claims, identities, payments, and linked entities. Define fraud outcomes the insurer can defend, measure precision, recall, capture, and investigator workload against real capacity, then pilot early identity verification alongside claims-stage analytics. Build the business case from confirmed outcomes and avoided operating cost. Require every vendor to prove performance on the insurer's data before scaling.
