Insurance Companies Risk Management
Learn how insurance companies risk management works, from capital frameworks and AI analytics to real deployments that improve operations.
Written by AI for Insurance
A 221.8% baseline solvency ratio can fall to 123.3% under stress in the 2024 European insurance stress test, while the tested Solvency Capital Requirement rises from €309.3 billion to €332.1 billion under stress, according to EIOPA's 2024 Insurance Stress Test. That spread captures the central fact about insurance companies risk management: the function isn't a compliance appendix. It determines how much risk an insurer can write, how much capital it must preserve, how quickly claims teams can respond, and whether an AI deployment improves economics or merely adds another model to govern.
Modern insurers connect underwriting, claims, actuarial analysis, investments, reinsurance, technology, and regulatory reporting through a common risk discipline. The difficult work happens in the connections. A pricing change alters exposure, exposure changes capital consumption, capital consumption affects reinsurance and asset allocation, and operational controls determine whether the reported position can be trusted.
Table of Contents
- What Insurance Companies' Risk Management Really Means Today
- How Insurance Risk Management Became a Formal Discipline
- Core Mechanics of Insurer Risk Programs
- Major Risk Categories Insurers Must Measure and Cap
- AI and Analytics Tools Reshaping Insurer Risk Operations
- The Compound Risk Problem Most Programs Underestimate
- Building a Resilient Risk Function in 2026
What Insurance Companies' Risk Management Really Means Today
Insurance risk management is the operating system connecting capital adequacy, underwriting discipline, claims performance, and governance. Solvency II took effect in Europe in 2016, linking capital planning to a risk-based SCR instead of a simple premium-volume calculation. Spain's reported solvency ratio remained broadly stable in 2024, at 238% compared with 239% in 2023. Eligible own funds were €62,023 million, against an SCR of €26,040 million, as documented in the EIOPA stress-test documentation.
The operating sequence is direct:
- Identify the exposures the insurer accepts.
- Estimate the loss distribution and resulting capital requirement.
- Set authority limits, pricing rules, reinsurance structures, and escalation triggers.
- Compare actual experience with assumptions.
- Reallocate capital and management attention as conditions change.
This sequence applies to a commercial property binder, life-insurance lapse assumptions, and an automated claims workflow. The control question is the same: does the decision remain within the insurer's risk appetite, and can its performance be measured after deployment? A useful primer on exposure, peril, control, and capital is this explanation of what insurance risk means in practice.
Key solvency metrics across major insurance markets
| Region | Framework | Recent average ratio | Capital status |
|---|---|---|---|
| Europe | Solvency II | 221.8% baseline, 123.3% stressed | Capital remains above SCR in the reported stress scenario |
| Spain | Solvency II | 238% in 2024 | Eligible own funds exceed SCR |
| European life insurers | Risk-based solvency reporting | 222% average SCR coverage in one 2024 analysis | Coverage is materially above required capital |
| United Kingdom life insurers | Risk-based solvency reporting | 188% weighted average SCR coverage in the same analysis | Coverage remains above required capital |
Capital ratios describe capacity, not operating quality. An insurer can report a high ratio while carrying concentration, model uncertainty, weak data lineage, or dependencies that its capital model treats too lightly. For actuaries, the test is whether assumptions remain credible. Underwriters must ask whether growth consumes capital faster than pricing compensates. Claims leaders need to know whether automation improves throughput without weakening controls. CROs need dashboards that expose pressure before solvency deteriorates. That is how AI deployment moves from a technology project to measurable risk, service, and capital management.
How Insurance Risk Management Became a Formal Discipline
Insurance risk management developed from actuarial and financial practices that became more integrated after World War II. Historical research places the term risk management in use during the early 1950s, while broader acceptance of risk management as an approved field of study emerged during the 1970s. The field then expanded alongside derivatives, portfolio theory, internal models, and increasingly formal capital formulas, as described in this historical account of risk management's development.
The shift mattered because insurers stopped treating risk as a collection of isolated technical questions. Actuaries still estimated mortality, morbidity, lapse, expenses, and claims. Investment teams still managed duration and credit exposure. But management increasingly needed a combined view: how could underwriting losses, asset movements, counterparty failures, and operational events affect the balance sheet at the same time?
From historical losses to capital models
The derivatives expansion of the 1970s and 1980s pushed financial firms to formalize market and counterparty risk. Insurers developed stronger internal measurement practices because investment guarantees, liability sensitivity, and asset volatility could no longer be managed separately. Regulatory models followed the same direction, requiring firms to demonstrate that capital reflected the risks in their portfolios.
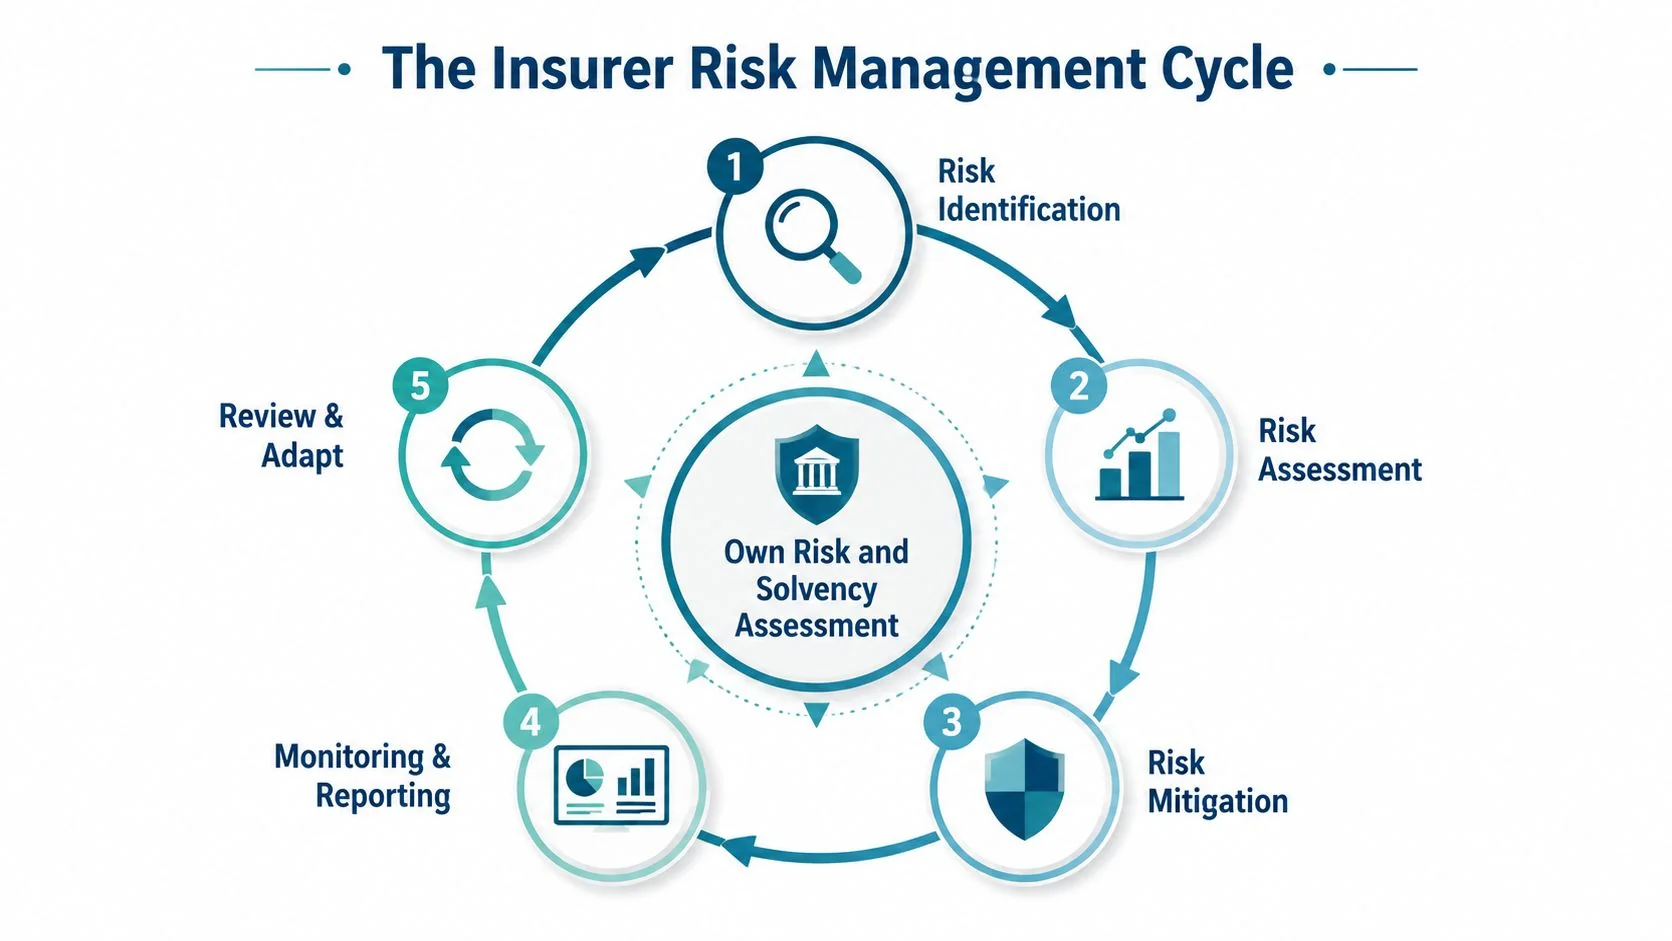
Solvency II completed a major European transition by making risk-based capital, governance, disclosure, and the Own Risk and Solvency Assessment central to insurer management. The result is a cycle rather than an annual filing exercise. Management identifies risks, assesses capital needs, chooses mitigations, reports the position, and revises the program when experience or strategy changes.
That history explains why today's risk leader needs more than a compliance calendar. The role combines actuarial judgment, financial modeling, operational control design, technology governance, and business decision-making. A model that improves claims throughput but weakens auditability isn't a complete risk solution. A portfolio that grows premiums but consumes disproportionate catastrophe capital isn't automatically profitable.
Core Mechanics of Insurer Risk Programs
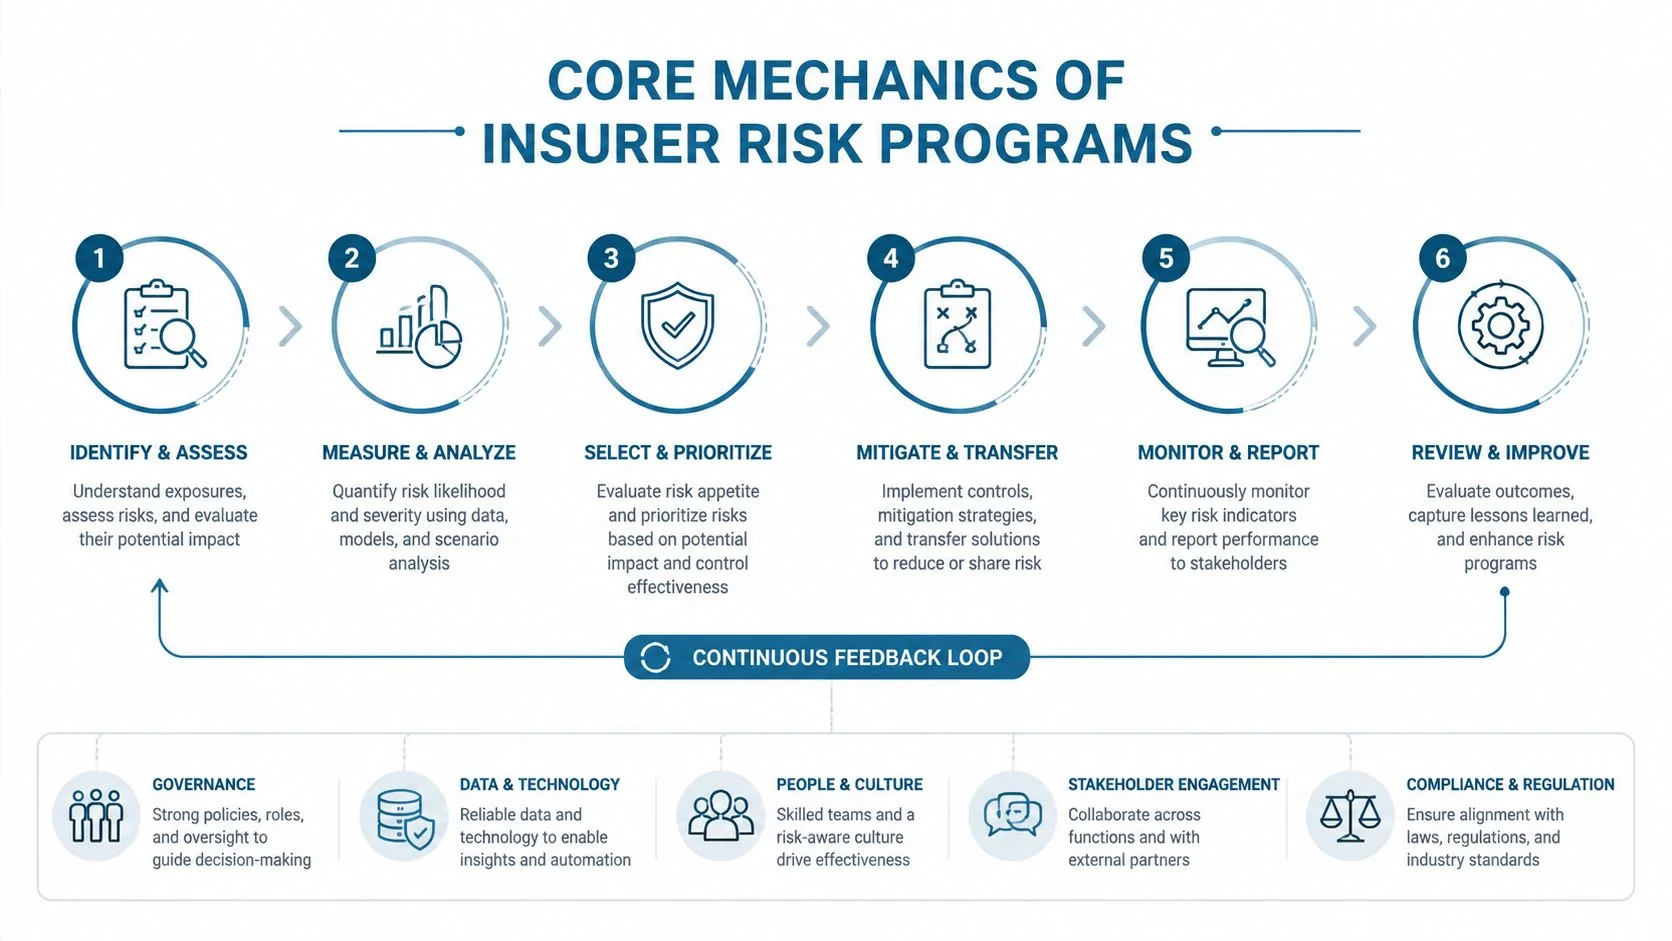
A mature risk program starts with a risk inventory, not a dashboard. Business leaders document exposures by line, geography, peril, counterparty, process, and system. Those entries feed the ORSA, which translates management's own view of risk into capital needs, stress scenarios, and planned responses.
Capital models then organize exposures into modules. Under Solvency II, an insurer may use the standard formula or an approved internal model, subject to governance and validation requirements. The central solvency calculation is:
SCR ratio = eligible own funds ÷ SCR
Risk-based capital regimes commonly calibrate solvency to a one-year 99.5% Value-at-Risk threshold, meaning available funds are intended to cover losses with only a 0.5% tail probability over the following year. Regulators separate market, life, general insurance, counterparty default, and operational risks, then aggregate them while recognizing diversification, as explained by the Hong Kong Insurance Authority's overview of the risk-based capital regime.
How a single underwriting decision travels through the system
Suppose an insurer adds a commercial property binder in a catastrophe-exposed area. The underwriting team changes the exposure register. Actuaries update expected losses and accumulation assumptions. The catastrophe module changes, which affects the SCR. The solvency ratio moves, and the CRO dashboard may trigger a review of authority limits, pricing adequacy, reinsurance, or portfolio concentration.
The same chain applies to life insurance. Capital adequacy testing uses projected cash flows under stressed assumptions, with distinct shocks for mortality, morbidity, lapse, expense, and catastrophe components. The OSFI life insurance capital guidance defines the requirement through the difference between the present value of shocked cash flows and best-estimate cash flows. Poor experience monitoring can therefore affect both required capital and pricing discipline.
Operational risk belongs inside this mechanics, not beside it. A claims platform outage, weak access control, or unreliable data feed can distort loss reporting and delay management action. Reinsurance provides another control lever by transferring defined loss layers and potentially reducing net capital strain, but only when recoverability, wording, collateral, and counterparty strength are tested.
Practical rule: Every material business decision should have a visible path to exposure, capital, limit, owner, and management action.
Quarterly CRO reporting should show more than a ratio. It should expose movement by risk module, limit utilization, concentration, stress results, data exceptions, model changes, and open remediation. That turns capital management into an operating discipline rather than a backward-looking report.
Major Risk Categories Insurers Must Measure and Cap
Insurers need a working taxonomy that links each risk family to a metric and a decision limit. The categories overlap, but they shouldn't disappear into an undifferentiated enterprise risk register.
Underwriting and market risk
Underwriting risk begins with loss experience, exposure quality, pricing adequacy, reserve development, and concentration. Teams use loss triangles, frequency and severity analysis, exposure curves, and combined-ratio sensitivity to identify deterioration. Limits may apply by class, territory, peril, account size, attachment point, or delegated authority.
Market risk sits on the asset and liability sides of the balance sheet. Investment teams monitor duration, interest-rate sensitivity, equity beta, spread exposure, and asset-liability mismatch. The cap isn't merely a portfolio percentage. It reflects how asset movements interact with guarantees, claims payments, and available capital.
Credit and operational risk
Credit risk includes reinsurer recoverables, broker balances, investment counterparties, and policyholder obligations. Insurers set exposure limits, diversify counterparties, monitor ratings and collateral, and test recoverables under stress.
Operational risk covers process failure, people, systems, data, outsourcing, and change management. Risk and control self-assessments, incident databases, control testing, access reviews, and service-level monitoring provide the evidence. A mature program links control failure to financial and regulatory consequences.
Cyber, climate, and liquidity risk
Cyber risk requires more than an external vulnerability score. Insurers model ransomware, data compromise, third-party concentration, claims-system disruption, and the possibility that their own cyber exposure overlaps with cyber coverage written for customers.
Climate risk has two distinct dimensions. Physical shocks affect property, agriculture, health, and infrastructure. Transition shocks affect asset values, counterparties, industries, and liability assumptions. Scenario analysis should therefore reach underwriting, investments, reinsurance, and operations.
Liquidity risk is tested through stressed cash-flow projections. The insurer needs to know whether premiums, investment income, collateral calls, claims payments, and asset sales remain synchronized under pressure.
| Risk category | Primary metric | Typical cap or limit |
|---|---|---|
| Underwriting | Loss ratio, combined-ratio sensitivity, accumulation | Authority, class, peril, and geographic limits |
| Market | Duration, spread sensitivity, equity beta | Asset allocation and mismatch limits |
| Credit | Counterparty exposure and recoverables | Counterparty, collateral, and concentration limits |
| Operational | Incident frequency, control exceptions, recovery performance | Process, system, and outsourcing tolerances |
| Cyber | Scenario loss, attack-surface exposure, recovery capability | Cyber appetite, access, and interruption limits |
| Climate | Physical and transition scenario loss | Exposure, sector, geography, and investment limits |
| Liquidity | Stressed cash-flow coverage | Minimum liquidity and funding triggers |
For a broader taxonomy of exposure types and control questions, see types of risk in the insurance industry. The important design choice is to assign every category an owner, a leading indicator, a maximum tolerance, and an escalation path.
AI and Analytics Tools Reshaping Insurer Risk Operations
AI changes risk management when it changes a decision, not when it merely adds a prediction. In underwriting, predictive models can combine hundreds of variables across exposure, behavior, location, claims history, and external context. Underwriters still need to test whether the variables are available, stable, explainable, and permissible for the intended decision.
Claims operations use document extraction, image analysis, natural-language processing, triage models, and workflow routing. These tools can identify missing information, classify severity, prioritize complex files, and send straightforward claims through controlled automation. The risk benefit comes from faster visibility and more consistent handling, while the control challenge is proving that automation doesn't suppress valid claims or reproduce historical bias.
Where the operating leverage appears
- Underwriting: Models can segment risk more finely, flag unusual submissions, and direct scarce expert capacity toward accounts requiring judgment.
- Claims: Triage engines can separate routine files from complex or suspicious cases, helping managers allocate adjusters and specialist reviews.
- Fraud: Network and graph analysis can reveal relationships among policies, claimants, providers, addresses, devices, and payment behavior that isolated rules miss.
- Actuarial work: Automated feature engineering and scenario tools can support pricing, reserving, and assumption monitoring, provided actuaries retain control over selection and validation.
- Prevention: Weather and sensor signals can prompt policyholder outreach before damage occurs, creating a direct connection between risk monitoring and loss prevention.
AI for Insurance maintains a searchable database of documented insurance AI implementations, organized by use case, line of business, technology, and disclosed outcomes. It can serve as a research input when teams compare implementation patterns, but each insurer still needs its own validation, governance, and economic assessment. More context on deployment patterns appears in the AI insurance landscape for 2026.
<iframe width="100%" style="aspect-ratio: 16 / 9;" src="https://www.youtube.com/embed/Nu4lHaSh7D4" frameborder="0" allow="autoplay; encrypted-media" allowfullscreen></iframe>
The control layer determines whether AI improves capital efficiency
A model can reduce manual work and still increase enterprise risk if its output isn't traceable. Effective infrastructure includes feature lineage, version control, monitoring for drift, challenger testing, human override rules, access controls, and documented approval thresholds. Model governance must also address how a change affects pricing, claims reserves, customer treatment, capital assumptions, and regulatory reporting.
The most useful performance review joins operational and financial measures. Leaders should examine throughput, exception rates, claims severity, leakage, reserve movement, pricing adequacy, and capital consumption together. That prevents a narrow productivity gain from being mistaken for a genuine improvement in loss economics.
The Compound Risk Problem Most Programs Underestimate
The hardest risk question is how cyber, climate, AI, and operational failures interact inside one loss event. Separate risk scores can obscure the dependency that determines the insurer's actual exposure.
A severe weather event can damage property, interrupt power, overload claims operations, impair suppliers, increase cyber exposure through emergency workarounds, and weaken the credit position of affected counterparties. Each risk team may model its own loss. The board experiences one combined event, with implications for claims throughput, reserve adequacy, liquidity, and capital.
The 2024 Aon Global Risk Management Survey places cyber among the leading current concerns, while AI rises among the most important risks over a longer horizon. Weather, natural disasters, and climate also remain prominent. The implication is a management gap around second-order correlations and compound loss, not merely a failure to identify individual risks. The insurance industry risk survey from Aon provides the cited basis for this assessment.
Why siloed models understate the loss
A property catastrophe model may estimate physical damage. A cyber model may estimate technology interruption, while a credit model estimates counterparty deterioration. If each assumes the others remain broadly independent, the aggregate result can appear safer than the operating reality.
The issue sharpens when AI models share data, features, vendors, or assumptions. A regime shift can produce correlated errors in pricing, claims triage, fraud detection, and reserving. Loss ratios may worsen while throughput falls, because the same distorted signals affect both risk selection and post-loss decisions.
Where operational gains appear
Compound-risk analysis should connect event chains to measurable operating outcomes:
- Build scenarios around linked events, not single perils.
- Map shared infrastructure, suppliers, data, and model dependencies.
- Test claims capacity and liquidity alongside insured loss.
- Add escalation triggers for simultaneous limit breaches.
- Require model owners to document performance under unfamiliar conditions.
A risk appetite that measures exposures separately can still permit an unacceptable combined exposure.
Capital allocation therefore depends on a conservative view of dependency. Perfect prediction is not required. Management should test whether diversification benefits remain credible under stress and whether reinsurance responds to the actual chain of events, rather than only its first loss mechanism. That analysis shows whether an AI deployment improves capital efficiency or shifts losses and bottlenecks into less visible parts of the operating model.
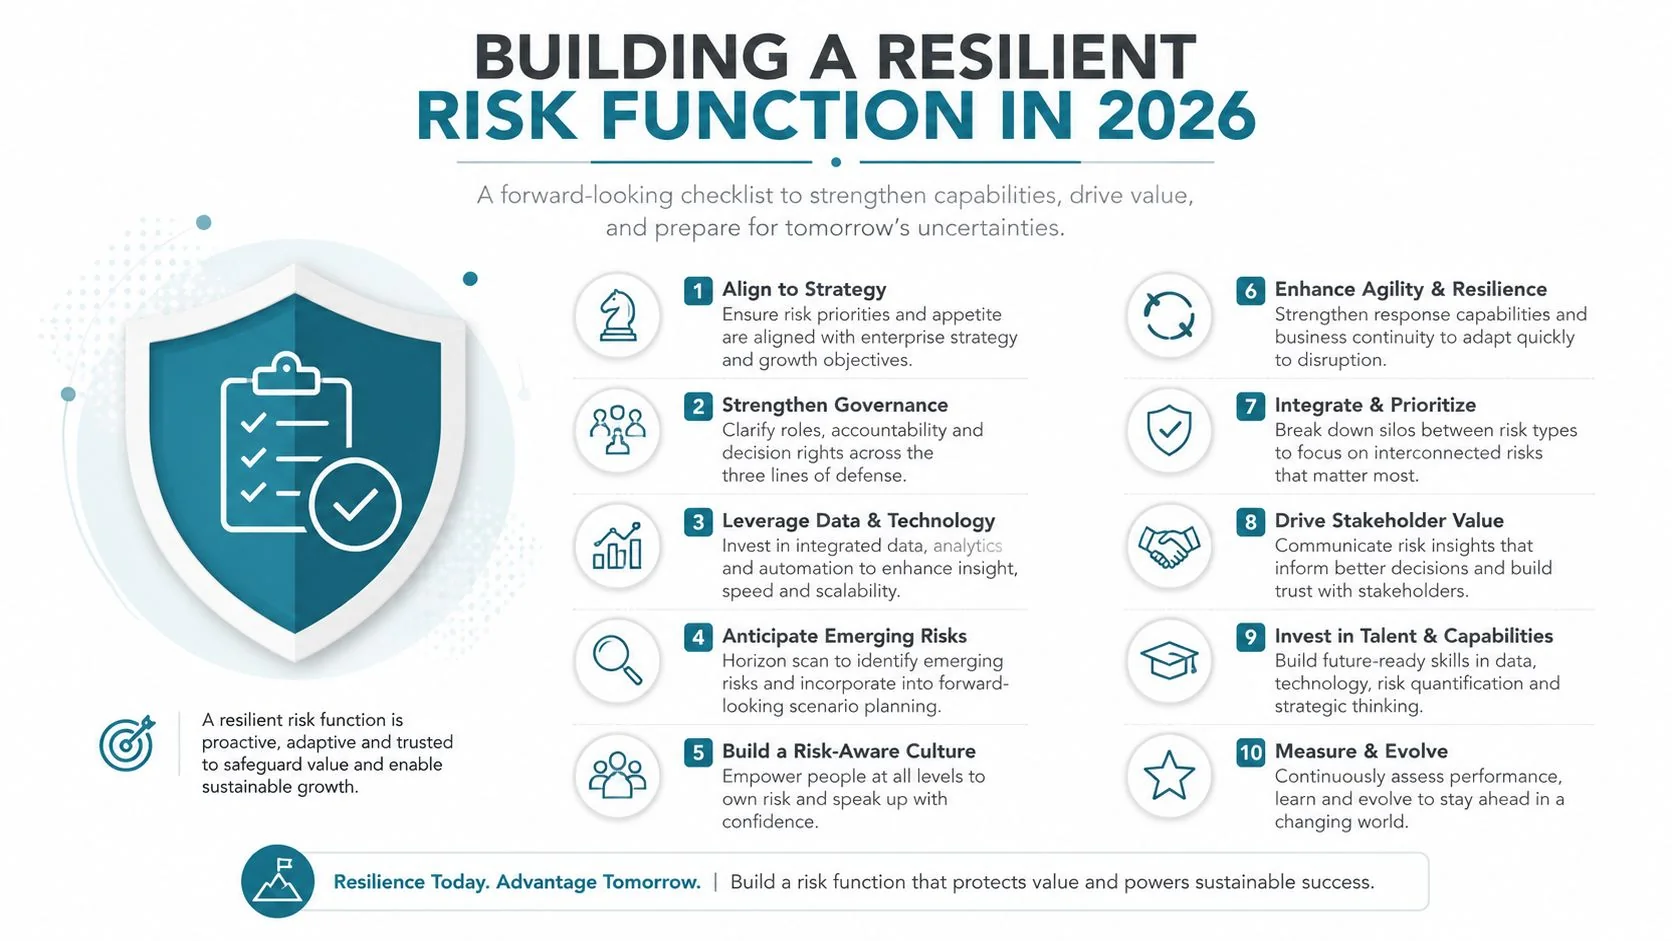
Building a Resilient Risk Function in 2026
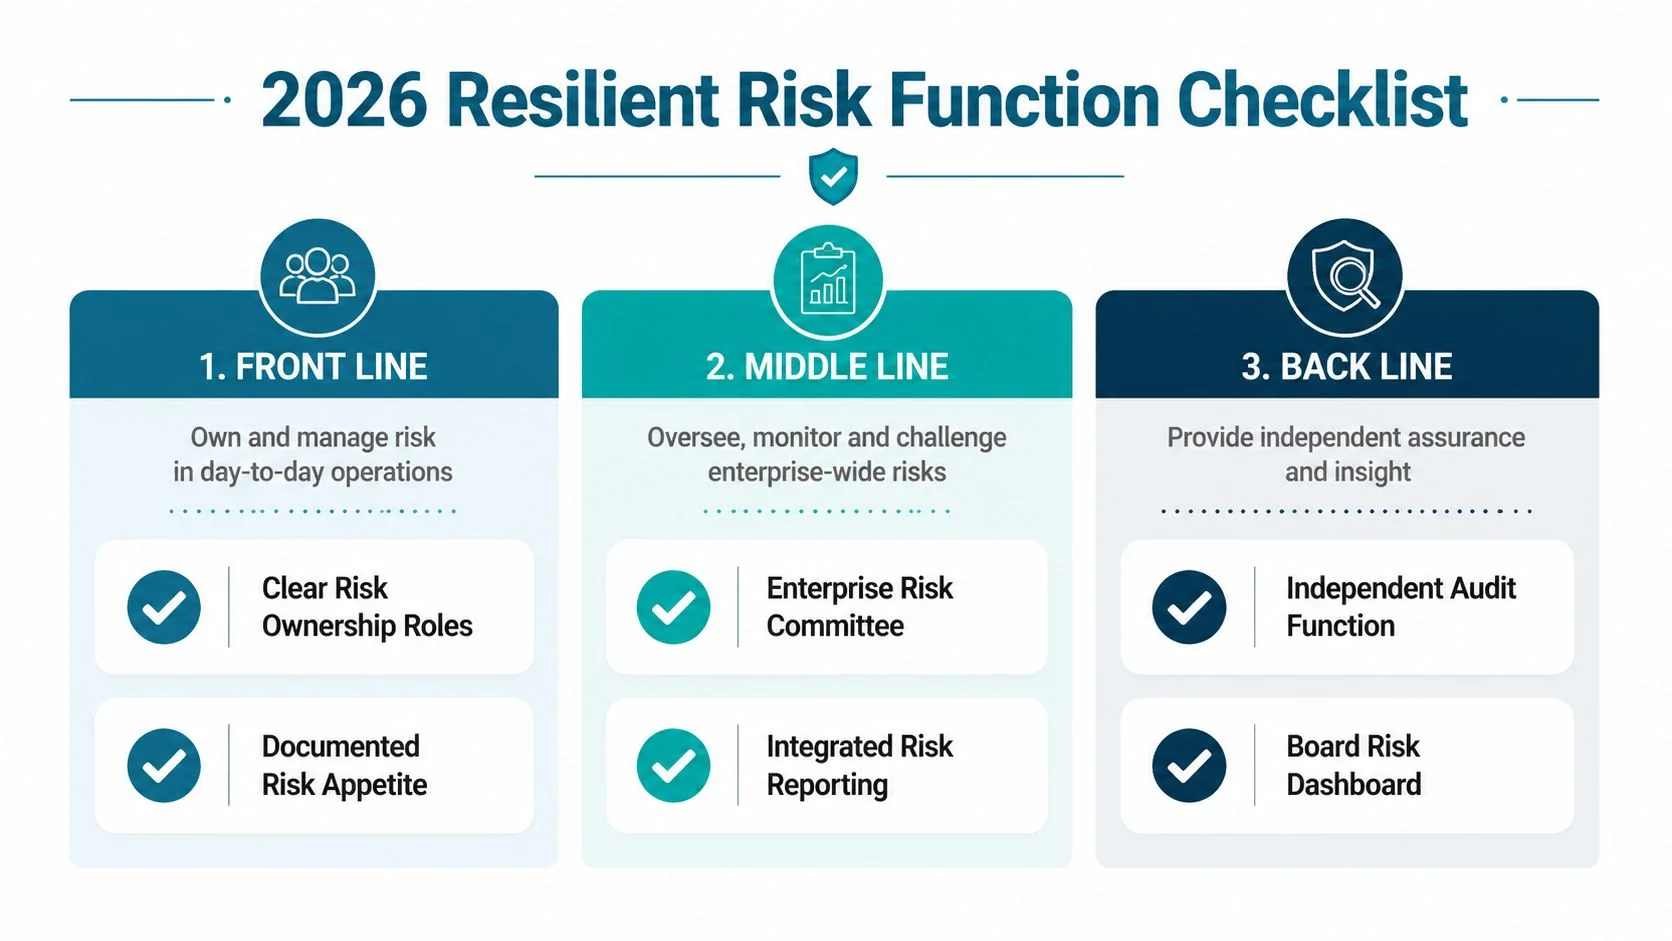
A resilient risk function starts with governance that assigns responsibility before an event occurs. The first line owns decisions and controls. The second line sets appetite, challenges assumptions, aggregates exposures, and reports exceptions. The third line tests whether the system works independently.
Establish the operating foundation
Write risk appetite statements in decision language. Specify what underwriting teams can bind, what concentrations require referral, what model changes require review, and which operational failures demand executive escalation. A board risk committee should receive reporting that connects appetite usage to capital, liquidity, claims service, and remediation.
A practical implementation sequence is:
- Create the exposure map. Connect policies, assets, counterparties, systems, suppliers, and data sources.
- Define the capital view. Map each material exposure to the relevant SCR or risk-based capital module.
- Set authority limits. Apply controls by line, peril, geography, accumulation, and delegated underwriting power.
- Build the scenario library. Include cyber disruption, physical catastrophe, climate transition, liquidity pressure, and model failure.
- Instrument leading indicators. Track rate adequacy, combined-ratio movement, claims frequency and severity, limit utilization, data exceptions, and model drift.
- Test response capacity. Run exercises that include claims operations, technology, treasury, communications, legal, and senior management.
Sequence investment by maturity
In the first phase, fix data lineage, ownership, risk registers, and reporting definitions. Without those foundations, advanced analytics can produce faster answers to poorly defined questions.
Next, strengthen model governance. Require documented purpose, data provenance, validation, monitoring, human intervention, and retirement criteria for every material model. Then integrate scenario outputs into pricing, reinsurance, capital planning, and board decisions rather than keeping them in a separate risk presentation.
Over the following planning cycle, mature operational resilience through control testing, recovery exercises, supplier reviews, and climate transition analysis. The EY guidance on strategic actions for insurance CROs in 2026 highlights the broader shift toward governance, operational resilience, internal controls, and capital and liquidity management.
Management test: If a risk indicator worsens, name the person who acts, the decision they can make, the evidence they need, and the capital or customer outcome that decision protects.
The strongest insurance companies risk management programs treat AI as part of this control architecture. They don't judge a deployment only by speed or model accuracy. They ask whether it improves selection, claims capacity, fraud control, loss prevention, and capital use while remaining explainable, monitored, and operationally reversible.
Build your insurer's next risk-management cycle around one live portfolio, one compound scenario, and one measurable decision. Map the exposures, assign owners, test the capital impact, and review the results with underwriting, claims, actuarial, technology, and finance leaders together. That exercise will show where your controls are strong, where your models are fragile, and which improvement should receive funding first.
